A-weighting
It is employed by arithmetically adding a table of values, listed by octave or third-octave bands, to the measured sound pressure levels in dB.
The resulting octave band measurements are usually added (logarithmic method) to provide a single A-weighted value describing the sound; the units are written as dB(A).
The curves were originally defined for use at different average sound levels, but A-weighting, though originally intended only for the measurement of low-level sounds (around 40 phon), is now commonly used for the measurement of environmental noise and industrial noise, as well as when assessing potential hearing damage and other noise health effects at all sound levels; indeed, the use of A-frequency-weighting is now mandated for all these measurements, because decades of field experience have shown a very good correlation with occupational deafness in the frequency range of human speech.
This research showed that our ears respond differently to random noise, and the equal-loudness curves on which the A, B and C weightings were based are really only valid for pure single tones.
[not verified in body] A-weighting began with work by Fletcher and Munson which resulted in their publication, in 1933, of a set of equal-loudness contours.
[citation needed] A-weighting is valid to represent the sensitivity of the human ear as a function of the frequency of pure tones.
However, because decades of field experience have shown a very good correlation between the A scale and occupational deafness in the frequency range of human speech,[citation needed] this scale is employed in many jurisdictions to evaluate the risks of occupational deafness and other auditory problems related to signals or speech intelligibility in noisy environments.
[4] Nevertheless, A-weighting would be a closer match to the equal loudness curves if it fell more steeply above 10 kHz, and it is conceivable that this compromise may have arisen because steep filters were more difficult to construct in the early days of electronics.
A-frequency-weighting is mandated by the international standard IEC 61672 to be fitted to all sound level meters and are approximations to the equal loudness contours given in ISO 226.
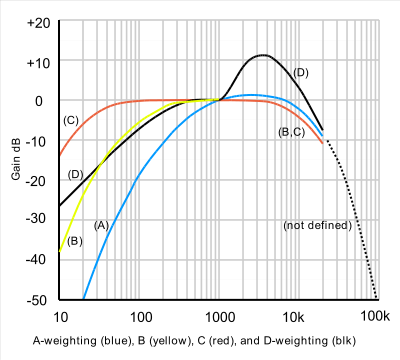
The large peak in the D-weighting curve is not a feature of the equal-loudness contours, but reflects the fact that humans hear random noise differently from pure tones, an effect that is particularly pronounced around 6 kHz.
Z- or ZERO frequency-weighting was introduced in the International Standard IEC 61672 in 2003 and was intended to replace the "Flat" or "Linear" frequency weighting often fitted by manufacturers.
[7][failed verification] As well, the C-frequency-weighting, with –3 dB points at 31.5 Hz and 8 kHz did not have a sufficient bandpass to allow the sensibly correct measurement of true peak noise (Lpk).
[nb 1] The A-weighting curve has been widely adopted for environmental noise measurement, and is standard in many sound level meters.
A-weighted sound power levels LWA are increasingly found on sales literature for domestic appliances such as refrigerators, freezers and computer fans.
This curve, which came out of work done by the BBC Research Department, and was standardised by the CCIR and later adopted by many other standards bodies (IEC, BSI) and, as of 2006[update], is maintained by the ITU.
It became widely used in Europe, especially in broadcasting, and was adopted by Dolby Laboratories who realised its superior validity for their purposes when measuring noise on film soundtracks and compact cassette systems.