Air pollution measurement
In urban environments, pollution may include many components, notably solid and liquid particulates (such as soot from engines and fly ash escaping from incinerators), and numerous different gases (most commonly sulfur dioxide, nitrogen oxides, and carbon monoxide, all related to fuel combustion).
These different forms of pollution have different effects on people's health, on the natural world (water, soil, crops, trees, and other vegetation), and on the built environment.
[2] Measuring air pollution is the first step in identifying its causes and then reducing or regulating them to keep the quality of the air inside legal limits (mandated by regulators such as the Environmental Protection Agency in the United States) or advisory guidelines suggested by bodies such as the World Health Organization (WHO).
[9] These constantly sample particulates and gases and produce moderately accurate, almost real-time measurements that can be analyzed by smartphone apps.
[16] Personal sensors can empower individuals and communities to better understand their exposure environments and risks from air pollution.
Public places such as busy railroad stations sometimes have active air quality monitors permanently fixed alongside platforms to measure levels of nitrogen dioxide and other pollutants.
Between the two extremes of large-scale static and small-scale wearable sensors are medium-sized, portable monitors (sometimes mounted in large wheelable cases) and even built into "smog-mobile" sampling trucks.
[26] In particular, buses have garnered considerable attention as a mobile sensing platform due to their widespread availability and extensive geographical coverage.
Analytical chemistry techniques used for measuring pollution include gas chromatography; various forms of spectrometry, spectroscopy, and spectrophotometry; and flame photometry.
Until the late 20th century, the amount of soot produced by something like a smokestack was often measured visually, and relatively crudely, by holding up cards with lines ruled onto them to indicate different shades of grey.
[33] In modern pollution monitoring stations, coarse (PM10) and fine (PM2.5) particulates are measured using a device called a tapered element oscillating microbalance (TEOM), based on a glass tube that vibrates more or less as collected particles accumulate on it.
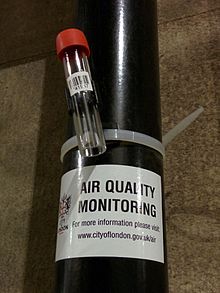
[38] Nitrogen dioxide (NO2) can be measured passively with diffusion tubes, though it takes time to collect samples, analyze them, and produce results.
[43] It can also be measured automatically much more quickly, by a chemiluminescence analyzer, which determines nitrogen oxide levels from the light they give off.
[46] Older methods of measuring sulfur dioxide involved passing air samples through glass bottles containing iodine, hydrogen peroxide, or sodium or potassium tetrachloromercurate.
It's relatively simple to convert one of these units into the other, taking account the different molecular weights of different gases and their temperatures and pressures.
[36][37] Urban air quality index (AQI) values are computed by combining or comparing the concentrations of a "basket" of common air pollutants (typically ozone, carbon monoxide, sulfur dioxide, nitrogen oxides, and both fine and coarse particulates) to produce a single number on an easy-to-understand (and often colour-coded) scale.
[66] This event, and similar ones such as the 1948 Donora smog tragedy in the United States,[67] became one of the great turning points in environmental history because they brought about a radical rethink in pollution control.
In the UK, the Great Smog of London lead directly to the Clean Air Act, which may have had consequences even more far reaching than it originally intended.