Benford's law
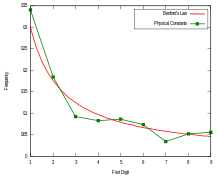
It has been shown that this result applies to a wide variety of data sets, including electricity bills, street addresses, stock prices, house prices, population numbers, death rates, lengths of rivers, and physical and mathematical constants.
[4] Like other general principles about natural data—for example, the fact that many data sets are well approximated by a normal distribution—there are illustrative examples and explanations that cover many of the cases where Benford's law applies, though there are many other cases where Benford's law applies that resist simple explanations.
The phenomenon was again noted in 1938 by the physicist Frank Benford,[7] who tested it on data from 20 different domains and was credited for it.
His data set included the surface areas of 335 rivers, the sizes of 3259 US populations, 104 physical constants, 1800 molecular weights, 5000 entries from a mathematical handbook, 308 numbers contained in an issue of Reader's Digest, the street addresses of the first 342 persons listed in American Men of Science and 418 death rates.
As a rule of thumb, the more orders of magnitude that the data evenly covers, the more accurately Benford's law applies.
For instance, one can expect that Benford's law would apply to a list of numbers representing the populations of United Kingdom settlements.
[18] Thus, real-world distributions that span several orders of magnitude rather uniformly (e.g., stock-market prices and populations of villages, towns, and cities) are likely to satisfy Benford's law very accurately.
On the other hand, a distribution mostly or entirely within one order of magnitude (e.g., IQ scores or heights of human adults) is unlikely to satisfy Benford's law very accurately, if at all.
[17][18] However, the difference between applicable and inapplicable regimes is not a sharp cut-off: as the distribution gets narrower, the deviations from Benford's law increase gradually.
(This discussion is not a full explanation of Benford's law, because it has not explained why data sets are so often encountered that, when plotted as a probability distribution of the logarithm of the variable, are relatively uniform over several orders of magnitude.
[20][21] The Krieger generator theorem might be viewed as a justification for the assumption in the Kafri ball-and-box model that, in a given base
The reason is that the logarithm of the stock price is undergoing a random walk, so over time its probability distribution will get more and more broad and smooth (see above).
[15][27] A similar probabilistic explanation for the appearance of Benford's law in everyday-life numbers has been advanced by showing that it arises naturally when one considers mixtures of uniform distributions.
[29][30] For example, the first (non-zero) digit on the aforementioned list of lengths should have the same distribution whether the unit of measurement is feet or yards.
[31][32] In 1972, Hal Varian suggested that the law could be used to detect possible fraud in lists of socio-economic data submitted in support of public planning decisions.
[34] Walter Mebane, a political scientist and statistician at the University of Michigan, was the first to apply the second-digit Benford's law-test (2BL-test) in election forensics.
A 2011 study by the political scientists Joseph Deckert, Mikhail Myagkov, and Peter C. Ordeshook argued that Benford's law is problematic and misleading as a statistical indicator of election fraud.
[37] Their method was criticized by Mebane in a response, though he agreed that there are many caveats to the application of Benford's law to election data.
[40] Another study used bootstrap simulations to find that the candidate Mehdi Karroubi received almost twice as many vote counts beginning with the digit 7 as would be expected according to Benford's law,[41] while an analysis from Columbia University concluded that the probability that a fair election would produce both too few non-adjacent digits and the suspicious deviations in last-digit frequencies as found in the 2009 Iranian presidential election is less than 0.5 percent.
According to Mebane, "It is widely understood that the first digits of precinct vote counts are not useful for trying to diagnose election frauds.
"[46][47] Similarly, the macroeconomic data the Greek government reported to the European Union before entering the eurozone was shown to be probably fraudulent using Benford's law, albeit years after the country joined.
Consequently, if the distribution of digits deviates from Benford's law (such as having a lot of 9's), it means merchants may have used psychological pricing.
Testing the number of published scientific papers of all registered researchers in Slovenia's national database was shown to strongly conform to Benford's law.
Morrow has determined the critical values for both these statistics, which are shown below:[55] Morrow has also shown that for any random variable X (with a continuous PDF) divided by its standard deviation (σ), some value A can be found so that the probability of the distribution of the first significant digit of the random variable
[58] If the goal is to conclude agreement with the Benford's law rather than disagreement, then the goodness-of-fit tests mentioned above are inappropriate.
[9][68] A number of criteria, applicable particularly to accounting data, have been suggested where Benford's law can be expected to apply.
[17] The derivation says that Benford's law is followed if the Fourier transform of the logarithm of the probability density function is zero for all integer values.
Smith summarizes thus (p. 716): Benford's law is followed by distributions that are wide compared with unit distance along the logarithmic scale.
Likewise, the law is not followed by distributions that are narrow compared with unit distance … If the distribution is wide compared with unit distance on the log axis, it means that the spread in the set of numbers being examined is much greater than ten.
In short, Benford’s law requires that the numbers in the distribution being measured have a spread across at least an order of magnitude.


