Bicycle performance
According to a study a human at 70 kg (150 lb) requires about 60 watts to walk at 5 km/h (3.1 mph) on firm and flat ground,[6] while according to a calculator at kreuzotter.de the same person and power output on an ordinary bicycle will travel at 15 km/h (9.3 mph),[7] so in these conditions the energy expenditure of cycling is about one-third that of walking the same distance.
Uphill cycling requires more power to overcome gravity and speeds are therefore lower and/or the heartrate is higher than during flat riding conditions.
[8] Maximum sustained power levels during one hour are recorded from about 200 W (NASA experimental group of "healthy men") to 500 W (Eddy Merckx on ergometer 1975).
For a day's pedalling these figures can roughly be halved, for a minute's duration doubled.
The rate of food consumption, i.e. the amount consumed during a certain period of time, is the input power.
This input power can be determined by measuring oxygen uptake, or in the long term food consumption, assuming no change of weight.
From the example above, if a 70 kg person is cycling at 15 km/h by expending 60 W and a muscular efficiency of 20% is assumed, roughly 1 kJ/km⋅kg extra food is required.
For calculating the total food required during the trip, the BMR must first be added to the input power.
If the 70 kg person is an old, short woman, her BMR could be 60 W, in all other cases a bit higher.
[10] Viewed this way the efficiency in this example is effectively halved and roughly 2 kJ/km⋅kg total food is required.
The group can maintain a higher speed over extended distance due to various cyclists taking turns at the head of the wind then dropping behind to rest.
Fitness cyclists use a speedometer or cyclocomputer to measure, record, and share several variables including speed, gradient, distance, time, cadence, slope, power (watts), temperature, GPS data, route, and even heart rate.
The highest speed officially recorded for any human-powered vehicle (HPV) on level ground and with calm winds and without external aids (such as motor pacing and wind-blocks, but including a defined amount of gravity assist) is 144.18 km/h (89.59 mph) set in 2016 by Todd Reichert in the Eta Speedbike, a streamlined recumbent bicycle.
[12] In the 1989 Race Across America, a group of HPVs crossed the United States in just 5 days.
[13][14][15][16] The highest speed officially recorded for a bicycle ridden in a conventional upright position under fully faired conditions was 82 km/h (51 mph) over 200 m.[17] That record was set in 1986 by Jim Glover on a Moulton AM7 at the Human Powered Speed Championships during Expo86 World Fair in Vancouver.
The fastest bicycle speed in slipstream is 296 km/h (183.9 mph), set by Denise Mueller-Korenek in 2018 on the Bonneville Salt Flats.
[9] There has been major corporate competition to lower the weight of racing bikes in order to be faster uphill and accelerating.
The UCI sets a limit of 6.8 kg on the minimum weight of bicycles to be used in sanctioned races.
[18] For cycling on the level at a constant speed, a large weight reduction saves only a negligible amount of power and it is on the contrary beneficial to add mass in the form of aerodynamic improvements.
E.g., a reduction of 10% of the total system weight (bicycle, rider, and luggage combined) will save nearly 10% power.
For example, the Analytic Cycling calculator Archived 2022-01-15 at the Wayback Machine gives a time/distance advantage of 0.16 s/188 cm for a sprinter with 500 g lighter wheels.
In a criterium race, if a rider has to brake entering each corner, then this is wasted as heat.
For 90 kg rider and bike, this adds roughly one third effort compared to the same ride at a steady speed, and a mass reduction of 10% of the total system weight (bicycle, rider, and luggage combined) could thus give about a 3% advantage.
Reducing their mass is thus especially noticeable in the case of sprints and corner "jumps" in a criterium.
[19] There are well-known equations that give the power required to overcome the various resistances mainly as a function of speed and operational parameters.
needed to overcome air drag or resistance is: where The concept of apparent wind is only directly applicable here if it comes from a true headwind or tailwind.
can be roughly approximated as 1 for usual cycling speeds of a rider on an upright bicycle.
Measurements on a roller-mechanism give low-speed coefficients of 0.003 to 0.006 for a variety of tires inflated to their maximum recommended pressures, increasing about 50% at 10 m/s.
For example, assuming no wind, one gets the following results for power delivered to the pedals (watts): Reducing the weight of the bike + rider by 1 kg would increase speed by 0.01 m/s at 9 m/s on the flat (5 seconds in a 32 km/h (20 mph), 40-kilometre (25 mile) time trial).


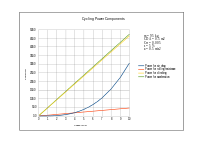
– Air drag power is initially very low and increases with the cube of the speed.
– Rolling resistance power is higher at first but rises only gently.
– Climbing a 5% grade is seen to be almost the same as continual acceleration with 0.5 m/s 2 .