Canada and the Kyoto Protocol
Debates surrounding the implementation of the Kyoto Protocol in Canada is influenced by the nature of relationships between national, provincial, territorial and municipal jurisdictions.
In 1980, when the National Energy Program was introduced, the country was almost torn apart, deeply dividing the provinces along an east–west axis.
[5] Some argue that when Prime Minister Stephen Harper took office in 2006, his strong opposition to the Kyoto Accord, his market-centred policies and "deliberate indifference"[5] contributed to a dramatic rise in GHG emissions.
[6][notes 2] Harper had previously denounced the Kyoto Protocol as a "socialist scheme to suck money out of wealth-producing nations" and pledged to fight against it in a 2002 fundraising letter addressed to Canadian Alliance members.
[9] In December 2011, the Ministry of the Environment Peter Kent announced Canada's withdrawal from the Kyoto Accord one day after negotiators from nearly 200 countries meeting in Durban, South Africa, at the 2011 United Nations Climate Change Conference completed a marathon of climate talks to establish a new treaty to limit carbon emissions.
Kent argued that "The Kyoto protocol does not cover the world's largest two emitters, the United States and China, and therefore cannot work."
Kent argued that since Canada could not meet targets, it needed to avoid the $14 billion in penalties for not achieving its goals.
The largest contributor to Canada's GHG emissions is the energy sector, which includes power generation (heat and electricity), transportation, and fugitive sources.
[notes 5] These are the emission profiles based on the United Nations Framework Convention on Climate Change Review of Canada's Annual Report, which includes data from 1990 to 2008.
The main cause of these high GHG emissions is Canada's hydrocarbon consumption—at 8,300 kilograms of crude oil equivalent per person per year, the highest in the world.
The energy industry generates about a quarter of Canada's export revenues and employs some 650,000 people across the country.
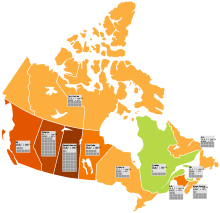
2 eq. per capita