Candlestick chart
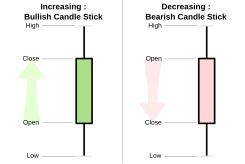
While similar in appearance to a bar chart, each candlestick represents four important pieces of information for that day: open and close in the thick body, and high and low in the "candle wick".
[citation needed] Candlestick charts are most often used in technical analysis of equity and currency price patterns.
[2] They were introduced to the Western world by Steve Nison in his book Japanese Candlestick Charting Techniques, first published in 1991.
As will be seen later, when I discuss the evolution of the candle charts, it was more likely that candle charts were developed in the early part of the Meiji period in Japan (in the late 1800s).The area between the open and the close is called the real body, price excursions above and below the real body are shadows (also called wicks).
[6] Candlestick charts are a visual aid for decision making in stock, foreign exchange, commodity, and option trading.
By looking at a candlestick, one can identify an asset's opening and closing prices, highs and lows, and overall range for a specific time frame.