Circle diagram
The circle diagram (also known as Heyland diagram or Heyland circle) is the graphical representation of the performance of the electrical machine[1][2][3] drawn in terms of the locus of the machine's input voltage and current.
[4] It was first conceived by Alexander Heyland [de] in 1894 and Bernhard Arthur Behrend in 1895.
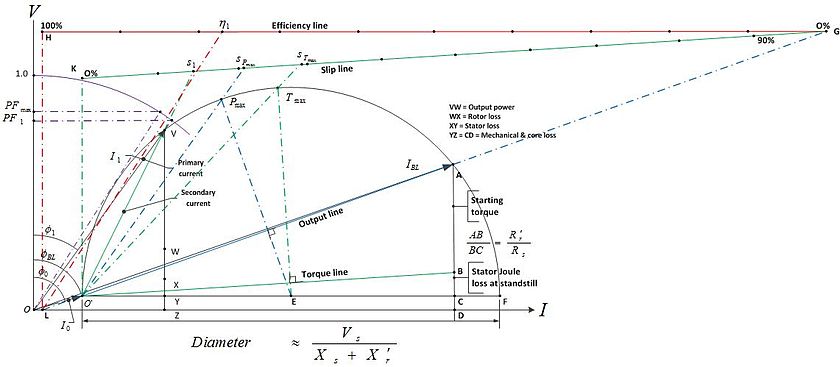
The Heyland diagram is an approximate representation of a circle diagram applied to induction motors, which assumes that stator input voltage, rotor resistance and rotor reactance are constant and stator resistance and core loss are zero.
[3][5][6] Another common circle diagram form is as described in the two constant air-gap induction motor images shown here,[7][8] where, The circle diagram is drawn using the data obtained from no load and either short-circuit or, in case of machines, blocked rotor tests by fitting a half-circle in points O' and A.
Beyond the error inherent in the constant air-gap assumption, the circle diagram introduces errors due to rotor reactance and rotor resistance variations caused by magnetic saturation and rotor frequency over the range from no-load to operating speed.