Climate classification
Originally, climes were defined in Ancient Greece to describe the weather depending upon a location's latitude.
Examples of genetic classification include methods based on the relative frequency of different air mass types or locations within synoptic weather disturbances.
This tropical zone is further broken down into rainforest, monsoon, and savanna based on seasonal rainfall.
They are widespread on Africa, and are found in India, the northern parts of South America, Malaysia, and Australia.
[15] Humid subtropical climates lie on the east side of continents, roughly between latitudes 20° and 40° degrees away from the equator.
[16] A humid continental climate is marked by variable weather patterns and a large seasonal temperature variance, cold and often very snowy winters, and warm summers.
[17] An oceanic climate is typically found along west coasts in higher middle latitudes of all the world's continents, and in southeastern Australia, and is accompanied by plentiful precipitation year-round, cool summers, and small annual ranges of temperatures.
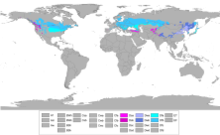
The Trewartha climate classification changes were seen as most effective on the large landmasses in Asia and North America, where many areas fall into a single group (C) in the Köppen–Geiger system.
[27] For example, under the standard Köppen system, Washington and Oregon are classed into the same climate zone (Csb) as parts of Southern California, even though the two regions have strikingly different weather and vegetation.
Another example was classifying cities like London or New York in the same climate group (C) as Brisbane or New Orleans, despite great differences in seasonal temperatures and native plant life.
Devised by the American climatologist and geographer C. W. Thornthwaite, this climate classification method monitors the soil water budget using evapotranspiration.
[33] Studies suggest that precipitation effectiveness (PE) within the Thornthwaite moisture index is overestimated in the summer and underestimated in the winter.
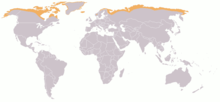
[34] Thermal classifications within the Thornthwaite scheme include microthermal, mesothermal, and megathermal regimes.
[37] A megathermal climate is one with persistent high temperatures and abundant rainfall, with potential annual evaporation in excess of 114 centimetres (45 in).


