Colors of noise
This sense of 'color' for noise signals is similar to the concept of timbre in music (which is also called "tone color"; however, the latter is almost always used for sound, and may consider detailed features of the spectrum).
That name was given by analogy with white light, which was (incorrectly) assumed to have such a flat power spectrum over the visible range.
Some of those names have standard definitions in certain disciplines, while others are informal and poorly defined.
Many of these definitions assume a signal with components at all frequencies, with a power spectral density per unit of bandwidth proportional to 1/f β and hence they are examples of power-law noise.
The Federal Standard 1037C Telecommunications Glossary[1][2] defines white, pink, blue, and black noise.
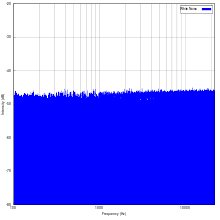
[citation needed] White noise is a signal (or process), named by analogy to white light, with a flat frequency spectrum when plotted as a linear function of frequency (e.g., in Hz).
In this case a white noise spectrum that is equally sampled in the logarithm of frequency (i.e., equally sampled on the X axis) will slope upwards at higher frequencies rather than being flat.
[3] The frequency spectrum of pink noise is linear in logarithmic scale; it has equal power in bands that are proportionally wide.
Since humans hear in such a proportional space, where a doubling of frequency (an octave) is perceived the same regardless of actual frequency (40–60 Hz is heard as the same interval and distance as 4000–6000 Hz), every octave contains the same amount of energy and thus pink noise is often used as a reference signal in audio engineering.
Since there are an infinite number of logarithmic bands at both the low frequency (DC) and high frequency ends of the spectrum, any finite energy spectrum must have less energy than pink noise at both ends.
[6] Retinal cells are arranged in a blue-noise-like pattern which yields good visual resolution.
[7] Cherenkov radiation is a naturally occurring example of almost perfect blue noise, with the power density growing linearly with frequency over spectrum regions where the permeability of index of refraction of the medium are approximately constant.
Cherenkov radiation also appears as a bright blue color, for these reasons.
Violet noise's power density increases 6.02 dB per octave with increasing frequency[8][9] "The spectral analysis shows that GPS acceleration errors seem to be violet noise processes.
Due to the diminished sensitivity of the human ear to high-frequency hiss and the ease with which white noise can be electronically differentiated (high-pass filtered at first order), many early adaptations of dither to digital audio used violet noise as the dither signal.
[citation needed] Acoustic thermal noise of water has a violet spectrum, causing it to dominate hydrophone measurements at high frequencies.
"Note that thermal noise increases at the rate of 20 dB decade−1"[11] Grey noise is random white noise subjected to a psychoacoustic equal loudness curve (such as an inverted A-weighting curve) over a given range of frequencies, giving the listener the perception that it is equally loud at all frequencies.
[citation needed] This is in contrast to standard white noise which has equal strength over a linear scale of frequencies but is not perceived as being equally loud due to biases in the human equal-loudness contour.
Velvet noise is a sparse sequence of random positive and negative impulses.
At high densities it sounds similar to white noise; however, it is perceptually "smoother".
[12] The sparse nature of velvet noise allows for efficient time-domain convolution, making velvet noise particularly useful for applications where computational resources are limited, like real-time reverberation algorithms.
In telecommunication, the term noisy white has the following meanings:[24] In telecommunication, the term noisy black has the following meanings:[25] Colored noise can be computer-generated by first generating a white noise signal, Fourier-transforming it, then multiplying the amplitudes of the different frequency components with a frequency-dependent function.
[26] Matlab programs are available to generate power-law colored noise in one or any number of dimensions.
Identifying the dominant noise type in a time series has many applications including clock stability analysis and market forecasting.
There are two algorithms based on autocorrelation functions that can identify the dominant noise type in a data set provided the noise type has a power law spectral density.
The first method for doing noise identification is based on a paper by W.J Riley and C.A Greenhall.
[27] First the lag(1) autocorrelation function is computed and checked to see if it is less than one third (which is the threshold for a stationary process):
Now discrete-time fractionally integrated noises have power spectral densities of the form
The other major difference between this and the previous method is that the differencing used to make the time series stationary (
This article incorporates public domain material from Federal Standard 1037C.