Color rendering index
The value often quoted as "CRI" on commercially available lighting products is properly called the CIE Ra value, "CRI" being a general term and CIE Ra being the international standard color rendering index.
Numerically, the highest possible CIE Ra value is 100 and would only be given to a source whose spectrum is identical to the spectrum of daylight, very close to that of a black body (incandescent lamps are effectively black bodies), dropping to negative values for some light sources.
[4][5] New standards, such as the IES TM-30, resolve these issues and have begun replacing the usage of CRI among professional lighting designers.
European researchers attempted to describe illuminants by measuring the spectral power distribution (SPD) in "representative" spectral bands, whereas their North American counterparts studied the colorimetric effect of the illuminants on reference objects.
[8] The CIE assembled a committee to study the matter and accepted the proposal to use the latter approach, which has the virtue of not needing spectrophotometry, with a set of Munsell samples.
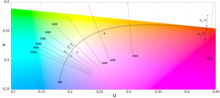
[11] To deal with the problem of having to compare light sources of different correlated color temperatures (CCT), the CIE settled on using a reference black body with the same color temperature for lamps with a CCT of under 5000 K, or a phase of CIE standard illuminant D (daylight) otherwise.
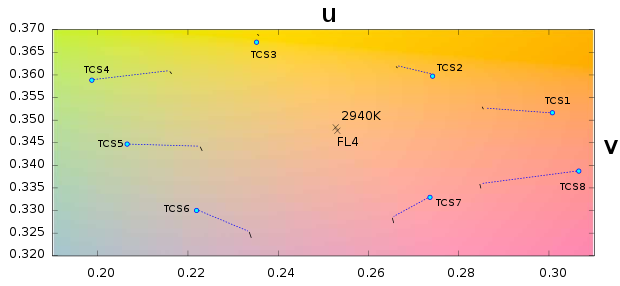
CIE (1995) uses this von Kries chromatic transform equation to find the corresponding color (uc,i, vc,i) for each sample.
The mixed subscripts (t, i) refer to the inner product of the test illuminant spectrum and the spectral reflexivity of sample i:
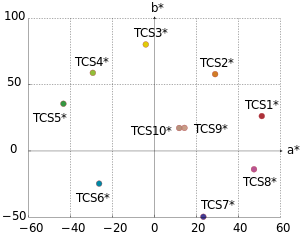
As specified in CIE (1995), the original test color samples (TCS) are taken from an early edition of the Munsell Atlas.
The first eight samples, a subset of the eighteen proposed in Nickerson (1960), are relatively low saturated colors and are evenly distributed over the complete range of hues.
The last six samples provide supplementary information about the color rendering properties of the light source; the first four for high saturation, and the last two as representatives of well-known objects.
The committee was dissolved in 1999, releasing CIE (1999), but no firm recommendations, partly due to disagreements between researchers and manufacturers.
As discussed in Sándor & Schanda (2005), CIE (1999) recommends the use of a ColorChecker chart owing to the obsolescence of the original samples, of which only metameric matches remain.
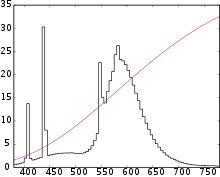
The SPDs of the standard test colors are tabulated in 5 nm increments CIE (2004), so it is suggested to use interpolation up to the resolution of the illuminant's spectrophotometry.
Calculation of the inner product of the SPD with the standard observer's color matching functions (CMFs) yields (X, Y, Z) = (109.2, 100.0, 38.9) (after normalizing for Y = 100).
The distance of the test point to the locus is under the limit (5.4×10⁻³), so we can continue the procedure, assured of a meaningful result:
R9 is one of the numbers of Ri refers to test color samples (TCS), which is one score in extended CRI.
So, generally, it is regarded as a supplement of color rendering index when evaluating a high-CRI light source.
So, if the R9 value is not good enough, the skin tone under this light will be more paleness or even greenish in your eyes or cameras.
[24] Ohno and others have criticized CRI for not always correlating well with subjective color rendering quality in practice, particularly for light sources with spiky emission spectra such as fluorescent lamps or white LEDs.
Davis & Ohno (2006) identify several other issues, which they address in their color quality scale (CQS): CIE (2007) "reviews the applicability of the CIE color rendering index to white LED light sources based on the results of visual experiments".
Chaired by Davis, CIE TC 1-69(C) is currently investigating "new methods for assessing the color rendition properties of white-light sources used for illumination, including solid-state light sources, with the goal of recommending new assessment procedures [...] by March, 2010".
Smet (2011) reviewed several alternative quality metrics and compared their performance based on visual data obtained in nine psychophysical experiments.
The differences in performance of these metrics with the other tested metrics (CIE Ra; CRI-CAM02UCS; CQS; RCRI; GAI; geomean (GAI, CIE Ra); CSA; Judd Flattery; Thornton CPI; MCRI) were found to be statistically significant with p < 0.0001.
[29] They carried out further experiments in real offices evaluating various spectra generated for combination existing and proposed color rendering metrics.
Developed in 2010 by Rea and Freyssinier, the gamut area index (GAI) is an attempt to improve over the flaws found in the CRI.
[9] Proponents of using GAI claim that, when used in conjunction with CRI, this method of evaluating color rendering is preferred by test subjects over light sources that have high values of only one measure.
Preliminary tests have shown that the combination of GAI and CRI used together is a preferred method for evaluating color rendering.
As a result, color rendition can be completely unpredictable in optical prints, transfers to digital media from film (DIs), and video camera recordings.
[37] Similar to the CRI, the metric measures quality of a light source as it would appear on camera on a scale from 0 to 100.