Commodity channel index
[1] Since its introduction, the indicator has grown in popularity and has become a very common tool for traders to identify cyclical trends not only in commodities but also equities and currencies.
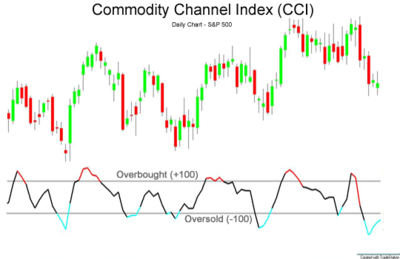
For scaling purposes, Lambert set the constant at 0.015 to ensure that approximately 70 to 80 percent of CCI values would fall between −100 and +100.
In addition to momentum, volume indicators and the price chart may also influence a technical assessment.
The CCI has seen substantial growth in popularity amongst technical investors; today's traders often use the indicator to determine cyclical trends in not only commodities, but also equities and currencies.
[3] Lambert's trading guidelines for the CCI focused on movements above +100 and below −100 to generate buy and sell signals.
Since Lambert's original guidelines, traders have also found the CCI valuable for identifying reversals.
The CCI is a versatile indicator capable of producing a wide array of buy and sell signals.
Based on a study of 43,297 backtested trades, the CCI indicator was found to be effective with specific settings on particular timeframes.
The research suggests the most reliable settings were CCI(50) crossing up through the -100 value on a daily chart.
Based on multiple timeframe analysis, using CCI on 5-minute charts is not recommended due to poor performance.