Demographics of Asian Americans
[8] The overall population is highly urbanized[9] and is concentrated in the West Coast of the United States and New York metropolitan area.
[14][15] The first recorded Asian Americans in the continental United States were a group of Filipino men who established the small settlement of Saint Malo, Louisiana, after fleeing mistreatment aboard Spanish ships.
[7] The total population of Asian Americans grew by 46 percent from 2000 to 2010 according to the Census Bureau, which constituted the largest increase of any major racial group during that period.
[32] The 2000 census recorded 11.9 million people (4.2 percent of the total population) who reported themselves as having either full or partial Asian heritage.
[35] The Twenty-first United States Census, conducted in 1990, recorded 6.9 million people who were called American Asians.
[36] Smaller populations, of less than two percent, were documented of the following ethnicities: Cambodian, Thai, Hmong, Pakistani, Indonesian, Malay, Bangladeshi, Sri Lankan, and Burmese.
[36] In 1990, 66 percent of American Asians were foreign-born, with Vietnamese, Laotians, and Cambodians having this highest foreign born populations.
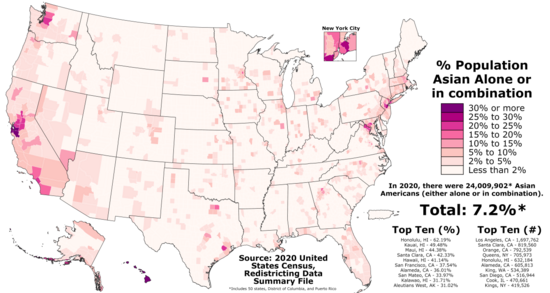
[37] New York City proper, according to the United States 2010 Census, is home to more than one million Asian Americans, greater than the combined totals of San Francisco and Los Angeles.
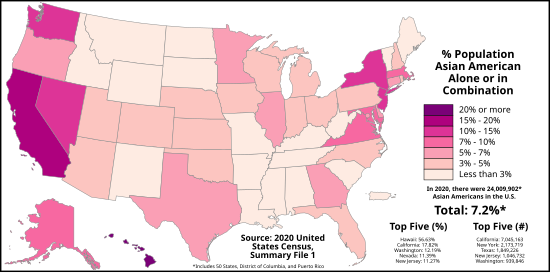
[41] According to the 2010 Census almost three quarters of all Asian Americans live in California, New York, Texas, New Jersey, Hawaii, Illinois, Washington, Florida, Virginia, and Pennsylvania.
These communities are often given unofficial names to reflect their populations, such as Chinatown, Little Manila, Little India, Japantown, Little Pakistan, Koreatown, Little Saigon, and Little Cambodia.
[59] That same year, Asian Americans in their late thirties had the highest percentage (65%) of college graduates for that age group than any other race or ethnicity in the United States.
[60] These high education attainment statistics contribute to a stereotype of academic and vocational excellence for Asian Americans.
[61] However, there are concerns that the goal of diversity in American higher education has had a negative effect on Asians, with charges of quotas and discrimination starting in the 1980s.
[63] A stereotype has been created that Asian Americans only study STEM and health-related fields at their universities (to become engineers, doctors, etc.).
[64] But according to a report by the College Board, Asian Americans do have academic interest in fields like social science, humanities, and education.
[65] According to an opinion piece written in The Harvard Crimson, Asian Americans are "over-represented" in higher education in the United States, specifically at elite colleges.
[67] Similar increases in Asian American enrollment was found in the University of California system, especially in the late 20th century.
[70] Issues related to social pressure and mental health are often overlooked due to the idea of the model minority.
Once country of birth and other demographic factors are taken into account, Asian Americans are no more likely than non-Hispanic whites to live in poverty.
[95] In 2008, Chinese, Japanese, Korean, Tagalog, and Vietnamese languages were all used in elections in Alaska, California, Hawaii, Illinois, New York, Texas, and Washington state.
[97][98][99] In 2012, Alaska, California, Hawaii, Illinois, Massachusetts, Michigan, Nevada, New Jersey, New York, Texas and Washington were publishing election material in Asian languages in accordance with the Voting Rights Act.
Only 39 percent of Asian American households belong to a local church or temple, due to atheism or adherence to Eastern religions without congregational traditions.
[107][108] A separate 2008 survey of the Pew Forum on Religion & Public Life found that 17% of Asians identify as Catholic, 17% as evangelical Protestant, 14% as Hindu, 11% as secular, 3% as atheist, 4% as agnostic, and 5% as other unaffiliated.
[104] Most Muslim Asian Americans come from, or trace their ancestry to, Bangladesh, China, India, Indonesia, Malaysia, and Pakistan.
[112] According to a Gallup survey conducted from June to September 2012, 4.3 percent of Asian Americans self identify as LGBT.