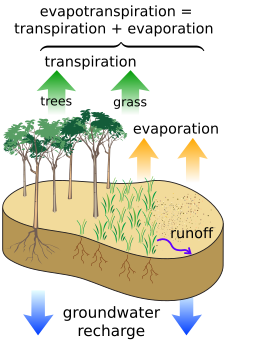
Evapotranspiration
"[2]: 2908 Evapotranspiration is a combination of evaporation and transpiration, measured in order to better understand crop water requirements, irrigation scheduling,[4] and watershed management.
1, "Units" Globally, it is estimated that on average between three-fifths and three-quarters of land precipitation is returned to the atmosphere via evapotranspiration.[7][8][9]: Ch.
1 Evapotranspiration does not, in general, account for other mechanisms which are involved in returning water to the atmosphere, though some of these, such as snow and ice sublimation in regions of high elevation or high latitude, can make a large contribution to atmospheric moisture even under standard conditions.
Levels of evapotranspiration in a given area are primarily controlled by three factors:[10] Firstly, the amount of water present.
Secondly, the amount of energy present in the air and soil (e.g. heat, measured by the global surface temperature); and thirdly the ability of the atmosphere to take up water (humidity).
[14] As a result, denser vegetation, like forests, may increase evapotranspiration and reduce water yield.
[15][16] In rainforests, water yield is increased (compared to cleared, unforested land in the same climatic zone) as evapotranspiration increases humidity within the forest (a portion of which condenses and returns quickly as precipitation experienced at ground level as rain).
The combined effect results in increased surface stream flows and a higher ground water table whilst the rainforest is preserved.
[17][18] In areas that are not irrigated, actual evapotranspiration is usually no greater than precipitation, with some buffer and variations in time depending on the soil's ability to hold water.
If potential evapotranspiration is greater than the actual precipitation, then soil will dry out until conditions stabilize, unless irrigation is used.
A lysimeter continuously measures the weight of a plant and associated soil, and any water added by precipitation or irrigation.
The SEBAL and METRIC algorithms solve for the energy balance at the Earth's surface using satellite imagery.
SEBAL and METRIC can map these key indicators in time and space, for days, weeks or years.
The Penman–Monteith variation is recommended by the Food and Agriculture Organization[20] and the American Society of Civil Engineers.
[21] The simpler Blaney–Criddle equation was popular in the Western United States for many years but it is not as accurate in wet regions with higher humidity.
Potential evapotranspiration is expressed in terms of a depth of water or soil moisture percentage.