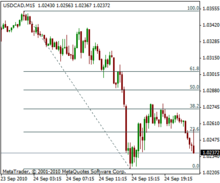
Fibonacci retracement
In finance, Fibonacci retracement is a method of technical analysis for determining support and resistance levels.
[1] It is named after the Fibonacci sequence of numbers,[1] whose ratios provide price levels to which markets tend to retrace a portion of a move, before a trend continues in the original direction.
[3] The appearance of retracement can be ascribed to price volatility as described by Burton Malkiel, a Princeton economist in his book A Random Walk Down Wall Street.
The main idea behind the tool is the support and resistance values for a currency pair trend at which the most important breaks or bounces can appear.
The retracement concept is used in many indicators such as Tirone levels, Gartley patterns, Elliott wave principle, and more.