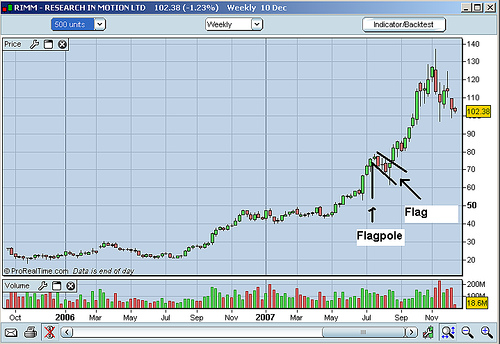
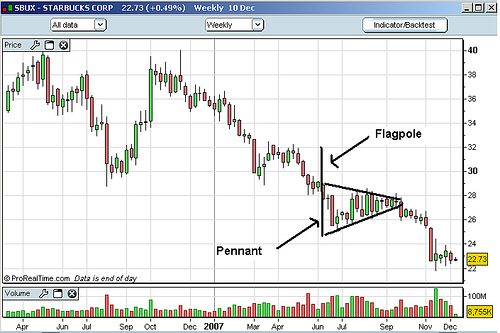
Flag and pennant patterns
[2] They are continuation patterns and form when the asset prices rally or fall sharply.
These lines can be either flat or pointed in the opposite direction of the primary market trend.
The pole is formed by a line which represents the primary trend in the market.
The pattern, which could be bullish or bearish, is seen as the market potentially just taking a "breather" after a big move before continuing its primary trend.
The pennant phase is identified by an initial large price movement indicating high volume transactions, followed by weaker price movement indicating low volume transactions.