FusionCharts
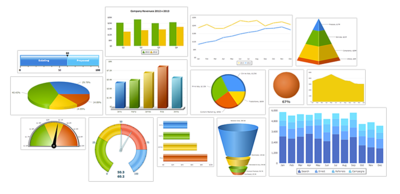
FusionCharts, part of InfoSoft Global (P) Ltd, is a privately held software provider of data visualization products (JavaScript Charts, Maps, Widgets and Dashboards) with offices in Bangalore and Kolkata, India.
[6] The idea behind FusionCharts was born in 2001 when 16-year-old Pallav Nadhani found himself dissatisfied with Microsoft Excel's charting capabilities while using the program to complete high school class assignments.
Nadhani subsequently authored an article on Wrox Press's ASPToday.com technology website which examined the thesis that Macromedia Flash, then used mainly for web banners and pop-up ad, could be used to build an interactive charting solution for business applications such as dashboards and reports.
Since arriving in Salt Lake, the staff has expanded by 250 percent of its original size, and in 2011 FusionCharts opened their second office in Bangalore.
[12] Pallav Nadhani's original ASPToday.com article called for creating a charting library using Flash, combined with ASP to power it with data.
Using XML and JSON as its data interfaces, FusionCharts Suite XT makes full use of HTML 5 technologies to create compact, interactive, and visually-arresting charts.
[13][14] British book publisher Packt UK has released a guidebook aimed at helping new users learn the basics of the FusionCharts Suite XT.

