GIS and aquatic science
To be able to keep up with these changes, technological advancements have given scientists methods to enhance all aspects of scientific investigation, from satellite tracking of wildlife to computer mapping of habitats.
In the past, GIS was not a practical source of analysis due to the difficulty in obtaining spatial data on habitats or organisms in underwater environments.
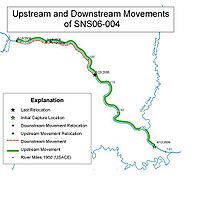
Over a period of time large amounts of data are collected and can be used to track patterns of migration, spawning locations and preferred habitat.
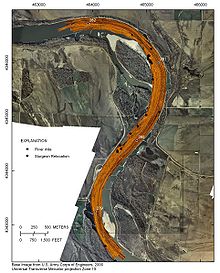
The US Geological Survey (USGS) in, cooperation with other agencies, were able to use GIS in helping map out habitat areas and movement patterns of pallid sturgeon.
A relational database was developed to manage tabular data for each individual sturgeon, including initial capture and reproductive physiology.
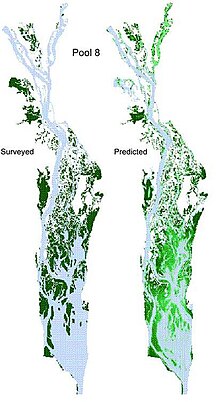
Through the use of GIS resource managers can assess the distributions of this important aspect of aquatic environments through a spatial and temporal scale.
These predictions for distribution of submerged aquatic vegetation can potentially have an effect on foraging birds by creating avoidance zones by humans.
By using known data of preexisting invasive species GIS models could predict future outbreaks by comparing biological factors.
The Connecticut Agricultural Experiment Station Invasive Aquatic Species Program (CAES IAPP) is using GIS to evaluate risk factors.