Fuel economy in automobiles
Driver behavior can affect fuel economy; maneuvers such as sudden acceleration and heavy braking waste energy.
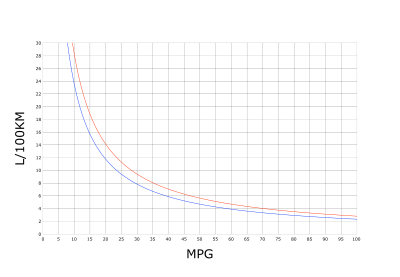
The fuel efficiency of motor vehicles can be expressed in multiple ways: The formula for converting to miles per US gallon (3.7854 L) from L/100 km is
The Mobil Oil Corporation sponsored it and the United States Auto Club (USAC) sanctioned and operated the run.
[6] The average[a] fuel economy for new 2020 model year cars, light trucks and SUVs in the United States was 25.4 miles per US gallon (9.3 L/100 km).
[15] In 1998, the U.S. Transportation Research Board footnoted an estimate that the 1974 National Maximum Speed Limit (NMSL) reduced fuel consumption by 0.2 to 1.0 percent.
Selling those cars in the United States is difficult because of emission standards, notes Walter McManus, a fuel economy expert at the University of Michigan Transportation Research Institute.
[22] An example of European cars' capabilities of fuel economy is the microcar Smart Fortwo cdi, which can achieve up to 3.4 L/100 km (69.2 mpg US) using a turbocharged three-cylinder 41 bhp (30 kW) Diesel engine.
[26] One method by car makers to increase fuel efficiency is lightweighting in which lighter-weight materials are substituted in for improved engine performance and handling.
[27] Identical vehicles can have varying fuel consumption figures listed depending upon the testing methods of the jurisdiction.
For a vehicle whose source of power is a heat engine (an engine that uses heat to perform useful work), the amount of fuel energy that a vehicle consumes per unit of distance (level road) depends upon: Ideally, a car traveling at a constant velocity on level ground in a vacuum with frictionless wheels could travel at any speed without consuming any energy beyond what is needed to get the car up to speed.
With ideal regenerative braking, the inertial energy could be completely recovered, but there are few options for reducing aerodynamic drag or rolling resistance other than optimizing the vehicle's shape and the tire design.
[37] A five-year partnership between Michelin and Anglian Water shows that 60,000 liters of fuel can be saved on tire pressure.
Vehicle manufacturers follow a controlled laboratory testing procedure to generate the fuel consumption data that they submit to the Government of Canada.
[44] In the European Union, passenger vehicles are commonly tested using two drive cycles, and corresponding fuel economies are reported as "urban" and "extra-urban", in liters per 100 km and (in the UK) in miles per imperial gallon.
[47] In the European Union advertising has to show carbon dioxide (CO2)-emission and fuel consumption data in a clear way as described in the UK Statutory Instrument 2004 No 1661.
The ASA have said that car manufacturers can use "cheats" to prepare their vehicles for their compulsory fuel efficiency and emissions tests in a way set out to make themselves look as "clean" as possible.
[53] The major loopholes in the current EU tests allow car manufacturers a number of "cheats" to improve results.
Car manufacturers can: According to the results of a 2014 study by the International Council on Clean Transportation (ICCT), the gap between official and real-world fuel-economy figures in Europe has risen to about 38% in 2013 from 10% in 2001.
The analysis was prepared by the ICCT together with the Netherlands Organization for Applied Scientific Research (TNO), and the German Institut für Energie- und Umweltforschung Heidelberg (IFEU).
[57][58] The distance of the cycle is 6.34 km (3.9 mi), average speed of 25.6 km/h (15.9 mph), and duration 892 seconds (14.9 minutes), including the initial 15 mode segment.
The running pattern with JC08 stretches out to 1200 seconds (20 minutes), and there are both cold and warm start measurements and top speed is 82 km/h (51.0 mph).
SFTO SC03 is the air conditioning test, which raises ambient temperatures to 95 °F (35 °C), and puts the vehicle's climate control system to use.
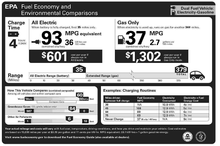
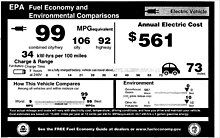
EPA also estimated an overall combined city/highway gas-electricity fuel economy rating expressed in miles per gallon gasoline equivalent (MPG-e).
This information was included to make the consumers aware of the variability of the fuel economy outcome depending on miles driven between charges.
This fuel economy equivalence is based on the energy consumption estimated in kWh per 100 miles, and also shown in the Monroney label.
The Corporate Average Fuel Economy (CAFE) regulations in the United States, first enacted by Congress in 1975,[78] are federal regulations intended to improve the average fuel economy of cars and light trucks (trucks, vans and sport utility vehicles) sold in the US in the wake of the 1973 Arab Oil Embargo.
[80] California's waivers were routinely granted until 2007, when the George W. Bush administration rejected the state's bid to adopt global warming pollution limits for cars and light trucks.
[79] Although the Trump administration was reportedly considering a compromise to allow state and national standards to stay in place,[86] on 21 February 2019 the White House declared that it had abandoned these negotiations.
Cars for example, can run on a number of fuel types other than gasoline, such as natural gas, LPG or biofuel or electricity which creates various quantities of atmospheric pollution.
A kilogram of carbon, whether contained in petrol, diesel, kerosene, or any other hydrocarbon fuel in a vehicle, leads to approximately 3.6 kg of CO2 emissions.