Graph drawing
In the concrete, however, the arrangement of these vertices and edges within a drawing affects its understandability, usability, fabrication cost, and aesthetics.
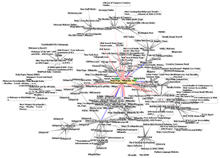
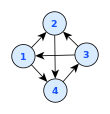
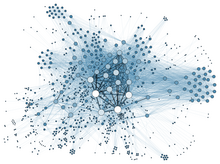
[4] Graphs are frequently drawn as node–link diagrams in which the vertices are represented as disks, boxes, or textual labels and the edges are represented as line segments, polylines, or curves in the Euclidean plane.
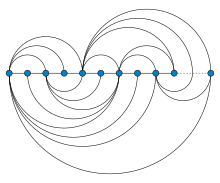
Pseudo-Lull drew diagrams of this type for complete graphs in order to analyze all pairwise combinations among sets of metaphysical concepts.
[5] In the case of directed graphs, arrowheads form a commonly used graphical convention to show their orientation;[2] however, user studies have shown that other conventions such as tapering provide this information more effectively.
Many different quality measures have been defined for graph drawings, in an attempt to find objective means of evaluating their aesthetics and usability.