Great Red Spot
The Great Red Spot is a persistent high-pressure region in the atmosphere of Jupiter, producing an anticyclonic storm that is the largest in the Solar System.
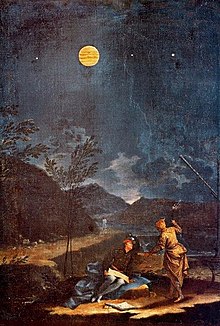
[10][11] Part of a series of panels in which different (magnified) heavenly bodies serve as backdrops for various Italian scenes, and all overseen by the astronomer Eustachio Manfredi for accuracy, Creti's painting is the first known depiction of the Great Red Spot as red (albeit raised to the Jovian northern hemisphere due to an optical inversion inherent to the era's telescopes).
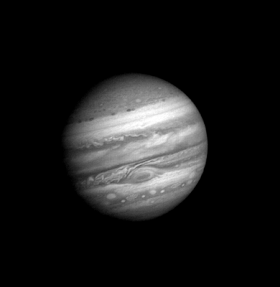
[4] On 25 February 1979,[12] when the Voyager 1 spacecraft was 9,200,000 km (5,700,000 mi) from Jupiter, it transmitted the first detailed image of the Great Red Spot.
The colorful, wavy cloud pattern seen to the left (west) of the Red Spot is a region of extraordinarily complex and variable wave motion.
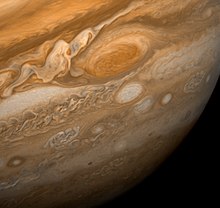
In 2004 its length was about half that of a century earlier, when it reached a size of 40,000 km (25,000 mi), about three times the diameter of Earth.
[21][22] Over the duration of the Juno mission, the spacecraft continued to study the composition and evolution of Jupiter's atmosphere, especially its Great Red Spot.
Measuring 16,350 km (10,160 mi) in width as of 3 April 2017, the Great Red Spot is 1.3 times the diameter of Earth.
[25] The storm has continued for centuries because there is no planetary surface (only a mantle of hydrogen) to cause friction; circulating atmospheric eddies persist because there is nothing to oppose their angular momentum.
[26] Infrared data has long indicated that the Great Red Spot is colder (and thus higher in altitude) than most of the other clouds on the planet.
[29] Careful tracking of atmospheric features revealed the Great Red Spot's counterclockwise circulation as far back as 1966, observations dramatically confirmed by the first time-lapse movies from the Voyager fly-bys.
[33] The Great Red Spot's latitude has been stable for the duration of good observational records, typically varying by about a degree.
System II is used for latitudes of more than 10 degrees and was originally based on the average rotational period of the Great Red Spot (9h 55m 42s).
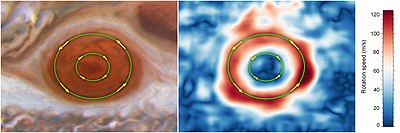
[41] During NASA's 2016 Juno mission, gravity signature and thermal infrared[41][42] data were obtained that offered insight into the structural dynamics and depth of the GRS.
[40] These MWR scans suggested that the GRS vertical depth extended to about 240 km below cloud level, with an estimated drop in atmospheric pressure to 100 bar.
[41] This structure is consistent with the data collected by the VISIR (VLT Mid-Infrared Imager Spectrometer on the ESO Very Large Telescope) imaging obtained in 2006; this revealed that the GRS was physically present at a wide range of altitudes that occur within the atmospheric pressure range of 80–600 mbar, and confirms the thermal infrared mapping result.
They aided in determining the southward jet movement and showed evidence of an increase in altitude of the column of aerosols with pressures ranging from 200–500 mbar.
[41][47] However, the NH3 composition data shows that there is a major depletion of NH3 below the visible cloud layer at the southern peripheral ring of the GRS; this lower opacity is relative to a narrow band of atmospheric subsidence.
[41] The low mid-IR aerosol opacity, along with the temperature gradients, the altitude difference, and the vertical movement of the zonal winds, are involved with the development and sustainability of the vorticity.