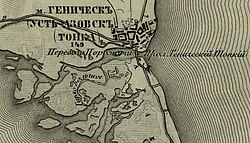
Hachure map
They show orientation of slope, and by their thickness and overall density they provide a general sense of steepness.
Being non-numeric, they are less useful to a scientific survey than contours, but can successfully communicate quite specific shapes of terrain.
Hachure representation of relief was standardized by the Austrian topographer Johann Georg Lehmann in 1799.
[2] Emil von Sydow designed maps with coloured hachures: green for lowlands and brown for highlands.
Hachures can also be used to represent water features such as coastlines or lakes, in which case they consist of fine parallel lines.