Labor force in the United States
[2] Before the pandemic, the U.S. labor force had risen each year since 1960 with the exception of the period following the Great Recession, when it remained below 2008 levels from 2009 to 2011.
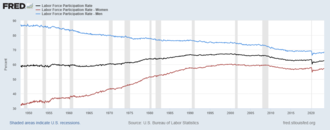
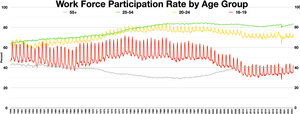
Labor force participation has declined steadily since 2000, primarily because of the aging and retirement of the Baby Boom generation.
Prime-aged men who are out of the labor force tend to be out due to disability, while a key reason for women is caring for family members.
[citation needed] Starting from 1960, the world and the U.S. witnessed a significant increase in female LFP in the labor market, especially in developed countries such as Europe and the U.S.
Claudia Goldin and others, specifically point out that by the mid-1970s there was a period of revolution of women in the labor force brought on by different factors.
[8][9] A common theory in modern economics claims that the rise of women participating in the US labor force in the late 1960s was due to the introduction of a new contraceptive technology, birth control pills, and the adjustment of age of majority laws.
[citation needed] According to the University of Chicago Press Journal, there was a significant change in women's first marriage and education careers.
[citation needed] Another factor that may have contributed to the trend was the Equal Pay Act of 1963, which aimed at abolishing wage disparity based on sex.
Such legislation diminished sexual discrimination and encouraged more women to enter the labor market by receiving fair remuneration to help raise children.
[citation needed] The Equal Pay Act protects both men and women against discrimination on account of sex in the payments of wages.
[citation needed] According to Claire Cain Miller, NYT, other wealthy countries, such as Denmark, Germany, and Norway, spend an average of $14,000 annually for childcare while the U.S. government supports only $500.
[needs update] In addition, a decline in male education participation, age of marriage, the rise of substance abuse, and addiction to video games could lead to a decrease in Men LFP.
This decrease in male labor force participation rate was probably from the benefit of disability insurance, especially in the group of less-educated men.
With these numbers, even though the labor force participation rate remained same, the aging in population still could affect and drag the LFPR down.
According to the 2020 Current Population Survey, most men reported that they were not able to work due to higher education, ill health, or disability, however, this is a self-report.
According to National Library of Medicine, the percentage of men diagnosed with depression was lower than women, yet the effect on the male labor force participation rate was considerable.
[22][23] Determinants under the occupation category include: income, housing, paid sick leave and health insurance; they are related to a person's socioeconomic status.
Income, Poverty, and Health Insurance The updated data from U.S Census Bureau in September 2022 does not change or is slightly different compared to last year's period.
The data from the National Center for Health Statistics, the ratio of adult aged from 18 to 64 that are uninsured tend to decrease and is related to households' income level.
[32][33] COVID-19 affected workers disproportionately, with Black and non-White races more likely to make up the baseline of the essential workforce this exposes to them to infections causing them to be unable to or to continue to work; FFCRA (2020) was passed in hopes of protecting workers but the ambiguity of the law puts minorities' paid sick leave at risk.
[38] A 2006 forecast by Federal Reserve economists (before the Great Recession that began in December 2007) estimated the LFPR would be below 64% by 2016, close to the 62.7% average that year.
Prior to the Great Recession, the rate was 83.3% in November 2007, then fell to a trough of 80.5% in July 2015, before steadily climbing back to 81.7% in January 2018.
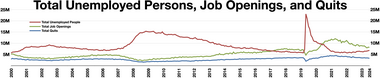
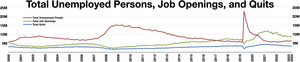
[49] The pandemic created a shift in the labor market where workers began voluntarily leaving their jobs in large numbers.
With the risks associated with returning to unsafe working conditions, lack of childcare, and overall employee burnout, employers were experiencing higher turnover rates with little evidence of slowdown.
[52] A Society for Human Resource Management (SHRM) survey found that younger people were less likely to leave the workforce than older generations.
[53] A shift in worker attitudes, overall priorities, and perception of their relationship with their jobs was a symptom of the pandemic, which forced many to drastically change the way they work and live.
For example, some workers developed a quiet quitting mindset by deliberately limiting their work activities to formal job descriptions, meeting yet not exceeding the preestablished expectations, and never volunteering for additional tasks.
[56] As of 2013, the highest group of people participating in the Foreign-born immigrant labor force in the United States were individuals from Mexico and Central America.
Since 1960, foreign-born immigrant women have the lowest labor market participation rate between all of the groups in the United States.
[58] Foreign-born immigrant women participate in the labor force between 75 and 78 percent lower than native born males.