Linear function (calculus)
In calculus and related areas of mathematics, a linear function from the real numbers to the real numbers is a function whose graph (in Cartesian coordinates) is a non-vertical line in the plane.
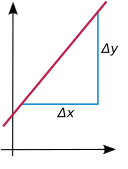
The coefficient a is called the slope of the function and of the line (see below).
defining a horizontal line, which some authors exclude from the class of linear functions.
[3] With this definition, the degree of a linear polynomial would be exactly one, and its graph would be a line that is neither vertical nor horizontal.
is required, so constant functions will be considered linear.
Such function defines a line that passes through the origin of the coordinate system, that is, the point
In advanced mathematics texts, the term linear function often denotes specifically homogeneous linear functions, while the term affine function is used for the general case, which includes
is a non-vertical line having exactly one intersection with the y-axis, its y-intercept point
the graph is a non-horizontal line having exactly one intersection with the x-axis, the x-intercept point
The slope measures the constant rate of change of
is decreasing In calculus, the derivative of a general function measures its rate of change.
The fundamental idea of differential calculus is that any smooth function
(not necessarily linear) can be closely approximated near a given point
generally varies with the point c. Linear functions can be characterized as the only real functions whose derivative is constant: if
can be written in several standard formulas displaying its various properties.
The simplest is the slope-intercept form: from which one can immediately see the slope a and the initial value
, we write the point-slope form: In graphical terms, this gives the line
may also be written to emphasize the constant slope: Linear functions commonly arise from practical problems involving variables
That is, one may consider y as a dependent variable (output) obtained from the independent variable (input) x via a linear function:
Suppose salami and sausage cost €6 and €3 per kilogram, and we wish to buy €12 worth.
Since salami costs twice as much as sausage, adding one kilo of salami decreases the sausage by 2 kilos:
corresponds to buying only 4 kg of sausage; while the x-intercept point
Note that the graph includes points with negative values of x or y, which have no meaning in terms of the original variables (unless we imagine selling meat to the butcher).
Also, we could choose y as the independent variable, and compute x by the inverse linear function:
If the coefficient of the variable is not zero (a ≠ 0), then a linear function is represented by a degree 1 polynomial (also called a linear polynomial), otherwise it is a constant function – also a polynomial function, but of zero degree.
A straight line, when drawn in a different kind of coordinate system may represent other functions.
For example, it may represent an exponential function when its values are expressed in the logarithmic scale.
With linear functions, increasing the input by one unit causes the output to increase by a fixed amount, which is the slope of the graph of the function.
With exponential functions, increasing the input by one unit causes the output to increase by a fixed multiple, which is known as the base of the exponential function.
If both arguments and values of a function are in the logarithmic scale (i.e., when log(y) is a linear function of log(x)), then the straight line represents a power law: On the other hand, the graph of a linear function in terms of polar coordinates: is an Archimedean spiral if