List of Thai provinces by GPP
This is a list of Thai provinces and regions by GDP and GDP per capita as of 2019, based on Gross Regional and Provincial Product Chain Volume Measures 2019 Edition, According to Office of the National Economic and Social Development Council (NESDC).
[1] Data for 2019 estimates (US$ at 2019 average market exchange rate,[2] international $ (I$) using 2019 PPP conversion factor from World Bank[3]) (millions) (millions) *Top country subdivisions by GDP *Top country subdivisions by GDP per capita *Top country metropolitan by GDP https://data.worldbank.org/indicator/NY.GDP.PCAP.PP.CD?locations=TH https://www.nesdc.go.th/ewt_dl_link.php?nid=5628&filename=gross_regional https://www.nesdc.go.th/more_news.php?cid=833&filename=index
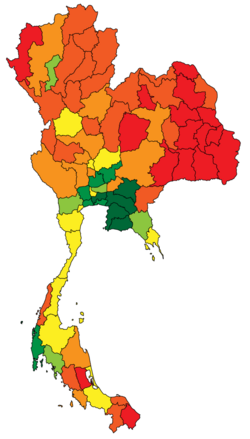
< 3,000 US$
3,000 - < 4,000 US$
4,000 - < 5,000 US$
5,000 - < 7,000 US$
7,000 - < 10,000 US$
10,000 - < 15,000 US$
> 15,000 US$