List of U.S. states and territories by incarceration and correctional supervision rate
This article has lists of US states and US territories by incarceration and correctional supervision rates.
The incarceration numbers include sentenced and unsentenced inmates from many categories.
The incarceration rate for a state or U.S. territory is calculated from the total of inmates across that location row in both tables.
[3] On January 1, 2008 more than 1 in 100 adults in the United States were in prison or jail.
[9] The United States has one of the highest rates of female incarceration.
[11] In the United States in 2016, women made up 9.8% of the incarcerated population in adult prisons and jails.
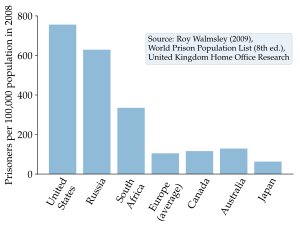
[16] Comparing other developed countries, the rate of Spain was 122 per 100,000 in 2020,[17] France was 90 per 100,000 in 2020,[18] Germany was 69 per 100,000 in 2020,[19] Norway was 49 per 100,000 in 2020,[20] Netherlands was 63 per 100,000 in 2018,[21] and Japan was 38 per 100,000 in 2019.
[22] The racial aspect of mass incarceration in the United States is striking.
According to Michelle Alexander (in 2010 book), the United States "imprisons a larger percentage of its black population than South Africa did at the height of apartheid.
[25] 2015 male and female incarceration and correctional supervision numbers.
From the source report: "This graph shows the number of people in state prisons, local jails, federal prisons, and other systems of confinement from each U.S. state and territory per 100,000 people in that state or territory and the incarceration rate per 100,000 in all countries with a total population of at least 500,000.