List of countries by economic complexity
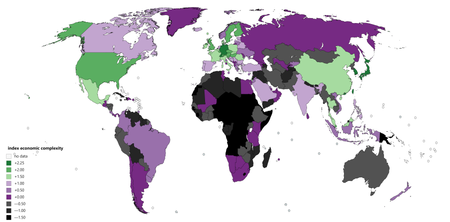
This list orders countries by their Economic Complexity Index (ECI), as it was defined and calculated by César Hidalgo and Ricardo Hausmann and published by The Observatory of Economic Complexity.
As an illustration, we can observe the differences between Egypt and Thailand in ECI ranking between the years of 1995 and 2015, let us use the below figures as an example: When we dig deeper into the export data of both countries, we can deduce that the differences were mainly in the composition of their relative export baskets.
The more countries direct their efforts to more sophisticated products, the more it is reflected in the ECI score, and hence their potential economic growth.
They had a relatively high growth as a share of their total export portfolio in monitors and projectors: 0.9 PCI, but they also had a growth in insulated wires which has a PCI of -0.48.
So, in general, we can observe that Thailand has expanded in products with higher PCI than the ones they phased out from, while Egypt expanded in some higher PCI products, and also some lower ones hence the difference in ECI growth between the two.