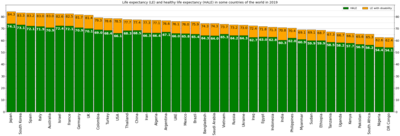
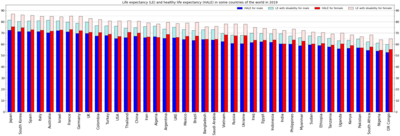
List of countries by life expectancy
The data is differentiated by sex, presenting life expectancies for males, females, and a combined average.
The figures serve as an indicator of the quality of healthcare in the respective countries and are influenced by various factors, including the prevalence of diseases such as HIV/AIDS.
There are challenges in comparing life expectancies across countries due to disparities in data reporting and collection standards.
The figures reflect the quality of healthcare in the countries listed as well as other factors including HIV infections.
All calculations were done on raw data, therefore, due to the nuances of rounding, in some places illusory inconsistencies of indicators arose, with a size of 0.01 year.
In 2014, some of the world's leading countries had a local peak in life expectancy, so this year is chosen for comparison with 2019 and 2022.

|
⩾ 84
82.00–83.99
80.00–81.99
78.00–79.99
76.00–77.99
74.00–75.99
|
72.00–73.99
70.00–71.99
68.00–69.99
66.00–67.99
64.00–65.99
62.00–63.99
|
60.00–61.99
58.00–59.99
56.00–57.99
54.00–55.99
|


|
≥ 80.0
75.0 – 79.9
|
70.0 – 74.9
65.0 – 69.9
|
60.0 – 64.9
55.0 – 59.9
|
< 55.0
no data
|

|
≥ 85.0
80.0 – 84.9
|
75.0 – 79.9
70.0 – 74.9
|
65.0 – 69.9
60.0 – 64.9
|
< 60.0
no data
|