Maunder Minimum
[4][5] Because Annie Maunder had not received a university degree, restrictions at the time caused her contribution not to be publicly recognized.
From text of eye-witness reports of events in 1652, 1706 and 1715, he concluded that the solar corona was weak in intensity and unstructured during the Maunder Minimum.
They were painted by a trained and skilful astronomer and observer, Maria Clara Eimmart, the daughter of the director of an observatory housed on a bastion of the walls of Nürnberg castle.
[13] A full discussion of these observations of the Maunder minimum corona and how the K-corona had partially returned by the time of the 1715 event is given by Hayakawa et al.
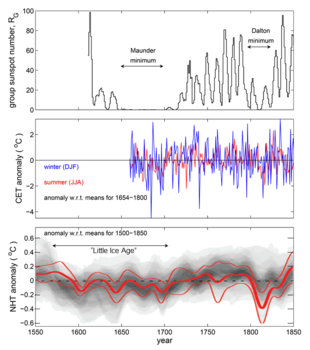
[12] The Maunder Minimum roughly coincided with the middle part of the Little Ice Age, during which Europe and North America experienced colder than average temperatures.
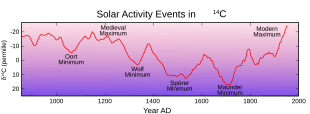
The scale of changes resulting in the production of carbon-14 in one cycle is small (about one percent of medium abundance) and can be taken into account when radiocarbon dating is used to determine the age of archaeological artifacts.
A paper based on an analysis of a drawing by John Flamsteed suggests that the Sun's surface rotation slowed in the deep Maunder Minimum (1684).
[30][31] This is somewhat surprising because the later, and less deep, Dalton sunspot minimum is clearly seen in auroral occurrence frequency, at least at lower geomagnetic latitudes.
[32] Because geomagnetic latitude is an important factor in auroral occurrence, (lower-latitude aurorae requiring higher levels of solar-terrestrial activity) it becomes important to allow for population migration and other factors that may have influenced the number of reliable auroral observers at a given magnetic latitude for the earlier dates.
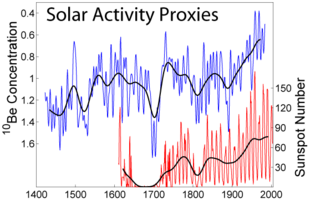
[33] Decadal-scale cycles during the Maunder Minimum can also be seen in the abundances of the beryllium-10 cosmogenic isotope (which unlike carbon-14 can be studied with annual resolution)[34] but these appear to be in antiphase with any remnant sunspot activity.