Methane emissions
[3][4] Seepages from near-surface hydrocarbon and clathrate hydrate deposits, volcanic releases, wildfires, and termite emissions account for much of the remainder.
[29][30] There is accumulating research and data showing that oil and gas industry methane emissions – or from fossil fuel extraction, distribution and use – are much larger than thought.
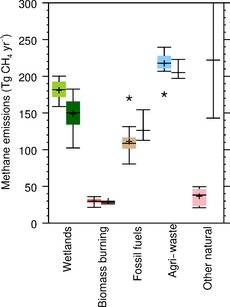
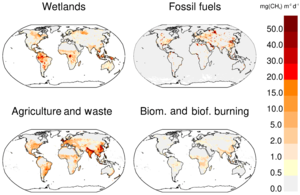
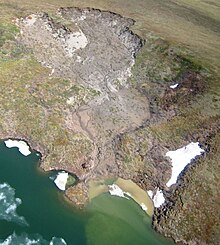
Wetlands are the largest natural source of atmospheric methane in the world, and are therefore a major area of concern with respect to climate change.
[45] The AR6 of the IPCC said, "It is unequivocal that the increases in atmospheric carbon dioxide (CO2), methane (CH4), and nitrous oxide (N2O) since the pre-industrial period are overwhelmingly caused by human activities.
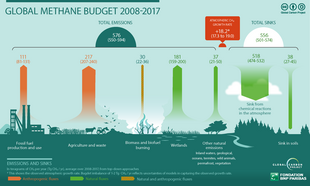
According to the 2021 assessment by the Climate and Clean Air Coalition (CCAC) and the United Nations Environment Programme (UNEP) over 50% of global methane emissions are caused by human activities in fossil fuels (35%), waste (20%), and agriculture (40%).
[57][58] Increases in methane levels due to modern human activities arise from a number of specific sources including industrial activity; from extraction of oil and natural gas from underground reserves;[59] transportation via pipeline of oil and natural gas; and thawing permafrost in Arctic regions, due to global warming which is caused by human use of fossil fuels.
[60]A 2005 Wuppertal Institute for Climate, Environment and Energy article identified pipelines that transport natural gas as a source of methane emissions.
"[62][63] Howarth called for policy changes to regulate methane emissions resulting from hydraulic fracturing and shale gas development.
[64] A 2013 study by a team of researchers led by Scot M. Miller, said that U.S. greenhouse gas reduction policies in 2013 were based on what appeared to be significant underestimates of anthropogenic methane emissions.
[65] The article said, that "greenhouse gas emissions from agriculture and fossil fuel extraction and processing"—oil and/or natural gas—were "likely a factor of two or greater than cited in existing studies.
[74]: 103 research in the Snowy Mountains region of Australia showed 8 tonnes of methane oxidized by methanotrophic bacteria per year on a 1,000 hectare farm.
However, generally within a year oxygen levels are depleted and anaerobic conditions dominate the landfill allowing methanogens to takeover the decomposition process.
[84] Waste water treatment facilities act to remove organic matter, solids, pathogens, and chemical hazards as a result of human contamination.
Whilst the Arctic region is one of many natural sources of the greenhouse gas methane, there is nowadays also a human component to this due to the effects of climate change.
[99] Methane emissions occur in all sectors of the natural gas industry, from drilling and production, through gathering and processing and transmission, to distribution.
The review concluded that in 2015 the oil and natural gas supply chain emitted 13 Tg per year of methane, which is about 60% more than the EPA report for the same time period.
The authors write that the most likely cause for the discrepancy is an under sampling by the EPA of so-called "abnormal operating conditions", during which large quantities of methane can be emitted.
The discovery was based on data from the European Space Agency's Scanning Imaging Absorption Spectrometer for Atmospheric Chartography instrument from 2002 to 2012.
The region emitted 590,000 metric tons of methane every year between 2002 and 2012—almost 3.5 times the widely used estimates in the European Union's Emissions Database for Global Atmospheric Research.
[101] In 2019, the International Energy Agency (IEA) estimated that the methane emissions leaking from the world's coalmines are warming the global climate at the same rate as the shipping and aviation industries combined.
[103] MethaneSAT is under development by the Environmental Defense Fund in partnership with researchers at Harvard University, to monitor methane emissions with an improved resolution of 1 kilometer.
[105] Uncertainties in methane emissions, including so-called "super-emitter" fossil extractions[106] and unexplained atmospheric fluctuations,[107] highlight the need for improved monitoring at both regional and global scale.
[117] The Claire satellite launched in 2016 by the Canadian firm GHGSat uses data from Tropomi to home in on sources of methane emissions as small as 15 m2.
[108] Other satellites are planned that will increase the precision and frequency of methane measurements, as well as provide a greater ability to attribute emissions to terrestrial sources.
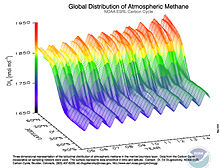
Global maps combining satellite data to help identify and monitor major methane emission sources are being built.
[128] However, in August 2020, the U.S. Environmental Protection Agency rescinded a prior tightening of methane emission rules for the U.S. oil and gas industry.
[129][130] About 40% of methane emissions from the fossil fuel industry could be "eliminated at no net cost for firms", according to the International Energy Agency (IEA) by using existing technologies.
[85] In 2023, the European Union agreed to legislation that will require fossil fuel companies to monitor and report methane leaks and to repair them within a short time period.
This rule requires large landfills that have ever accepted municipal solid waste, have been used as of November 8, 1987, can hold at least 2.5 million metric tons of waste with a volume greater than 2.5 million cubic meters, and/or have nonmethane organic compound (NMOC) emissions of at least 50 metric tons per year to collect and combust emitted landfill gas.
In an attempt to absorb the methane that is already being produced from landfills, experiments in which nutrients were added to the soil to allow methanotrophs to thrive have been conducted.