Natural gas prices
For rough comparisons, one million Btu is approximately equal to a thousand cubic feet of natural gas.
Natural gas as it comes out of the ground is most often predominantly methane, but may have a wide range of energy values, from much lower (due to dilution by non-hydrocarbon gases) to much higher (due to the presence of ethane, propane, and heavier compounds) than standard pipeline-quality gas.
Monthly contracts expire 3–5 days in advance of the first day of the delivery month, at which points traders may either settle their positions financially with other traders in the market (if they have not done so already) or choose to "go physical" and accept delivery of physical natural gas (which is actually quite rare in the financial market).
Once a particular day's gas obligations are finalized in the day-ahead market, traders (or more commonly lower-level personnel in the organization known as, "schedulers") will work together with counterparties and pipeline representatives to "schedule" the flows of gas into ("injections") and out of ("withdrawals") individual pipelines and meters.
Because market conditions vary between Henry Hub and the roughly 40 or so physical trading locations around United States, financial traders also usually transact simultaneously in financial "basis" contracts intended to approximate these differences in geography and local market conditions.
Cold temperatures in the winter increase the demand for space heating with natural gas in commercial and residential buildings.
The destruction of power lines interrupting electricity produced by natural gas can result in significant reduction in demand for a given area (e.g., Florida).
In the US for instance, recent demographic trends indicate an increased population movement to the Southern and Western states.
For instance, during the economic recession of 2001, U.S. natural gas consumption by the industrial sector fell by 6 percent.
This study also outlines the methodological and statistical assumptions and constraints that arise in estimating causal effects of energy reforms on household demand and poverty.
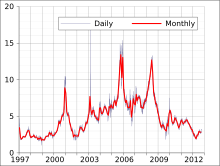
[11] Supply and demand dynamics in the marketplace determine the short term price for natural gas.
In general the core customers (residential and commercial) do not have this ability, however, a number of industrial and electric generation consumers have the capacity to switch between fuels.
This fuel switching then leads to a decrease for the demand of natural gas, which usually tends to drop its price.
When the storage levels are low, a signal is being sent to the market indicating that there is a smaller supply cushion and prices will be rising.
On the other hand, when storage levels are high, this sends a signal to the market that there is greater supply flexibility and prices will tend to drop.
The current pipeline infrastructure is quite developed, with the EIA estimating that the daily delivery capacity of the grid is 119×10^9 cu ft (3.4×10⁹ m3).
When supply is low relative to demand, prices rise; this gives a market signal to the producer to increase the number of rigs drilling for natural gas.
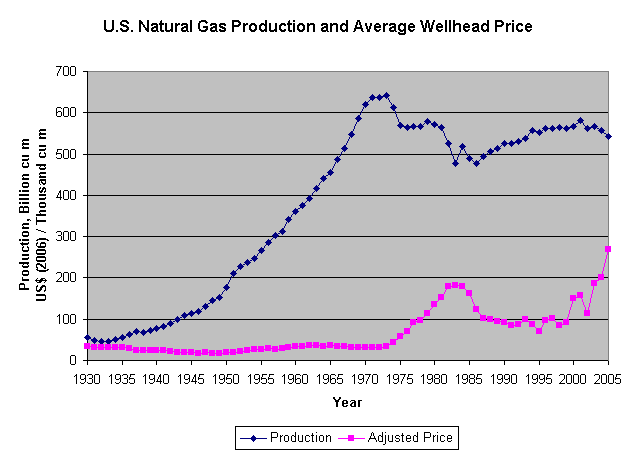
The chart shows a 75-year history of annual United States natural gas production and average wellhead prices from 1930 through 2005.
Prices reached a low of around (2006 US) $17/Mcm in the late 1940s, when more than 20 percent of the natural gas being withdrawn from U.S. reserves was vented or flared.
Beginning in 1954, the Federal Power Commission regulated the price of US natural gas transported across state lines.
Interior Department estimated that the Outer Continental Shelf of the United States held more than 15 trillion cubic meters of recoverable natural gas, equivalent to about 25 years of domestic consumption at present rates.
[23] The new technologies of hydraulic fracturing and horizontal drilling have increased these estimates of recoverable reserves to many hundreds of trillion cubic feet.
Hydraulic fracturing has reduced the Henry Hub spot price of natural gas considerably since 2008.
The increased shale gas production leads to a shift of supply away from the south to the northeast and midwest of the country.
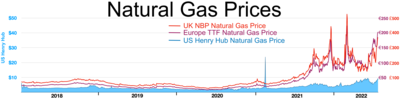
[25] One of the main objectives of the projected single EU energy market is a common pricing structure for gas products.
[29] In September 2013, it was reported that multiple factors have conspired to cause Europe as a whole to decrease its use of natural gas and make more use of coal.
In September 2021, gas prices in Europe reached all-time highs, following a collapse of wind-based power generation on account of low winds.

2000 - May 23, 2022