Outlier
[3][4] An outlier can be an indication of exciting possibility, but can also cause serious problems in statistical analyses.
This can be due to incidental systematic error or flaws in the theory that generated an assumed family of probability distributions, or it may be that some observations are far from the center of the data.
Outlier points can therefore indicate faulty data, erroneous procedures, or areas where a certain theory might not be valid.
However, in large samples, a small number of outliers is to be expected (and not due to any anomalous condition).
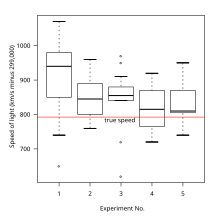
Naive interpretation of statistics derived from data sets that include outliers may be misleading.
In this case, the median better reflects the temperature of a randomly sampled object (but not the temperature in the room) than the mean; naively interpreting the mean as "a typical sample", equivalent to the median, is incorrect.
As illustrated in this case, outliers may indicate data points that belong to a different population than the rest of the sample set.
If the sample size is only 100, however, just three such outliers are already reason for concern, being more than 11 times the expected number.
Thus if one takes a normal distribution with cutoff 3 standard deviations from the mean, p is approximately 0.3%, and thus for 1000 trials one can approximate the number of samples whose deviation exceeds 3 sigmas by a Poisson distribution with λ = 3.
A physical apparatus for taking measurements may have suffered a transient malfunction.
Alternatively, an outlier could be the result of a flaw in the assumed theory, calling for further investigation by the researcher.
Model-based methods which are commonly used for identification assume that the data are from a normal distribution, and identify observations which are deemed "unlikely" based on mean and standard deviation: It is proposed to determine in a series of
The principle upon which it is proposed to solve this problem is, that the proposed observations should be rejected when the probability of the system of errors obtained by retaining them is less than that of the system of errors obtained by their rejection multiplied by the probability of making so many, and no more, abnormal observations.
(Quoted in the editorial note on page 516 to Peirce (1982 edition) from A Manual of Astronomy 2:558 by Chauvenet.)
[14][15][16][17] Other methods flag observations based on measures such as the interquartile range.
are the lower and upper quartiles respectively, then one could define an outlier to be any observation outside the range: for some nonnegative constant
[18] In various domains such as, but not limited to, statistics, signal processing, finance, econometrics, manufacturing, networking and data mining, the task of anomaly detection may take other approaches.
[21] Some approaches may use the distance to the k-nearest neighbors to label observations as outliers or non-outliers.
[22] The modified Thompson Tau test is a method used to determine if an outlier exists in a data set.
[23] The strength of this method lies in the fact that it takes into account a data set's standard deviation, average and provides a statistically determined rejection zone; thus providing an objective method to determine if a data point is an outlier.
[citation needed][24] How it works: First, a data set's average is determined.
where y is the assigned class label and x represent the input attribute value for an instance in the training set t).
Even when a normal distribution model is appropriate to the data being analyzed, outliers are expected for large sample sizes and should not automatically be discarded if that is the case.
As mentioned earlier, if the outlier's origin can be attributed to an experimental error, or if it can be otherwise determined that the outlying data point is erroneous, it is generally recommended to remove it.
Removing a data point solely because it is an outlier, on the other hand, is a controversial practice, often frowned upon by many scientists and science instructors, as it typically invalidates statistical results.
[26][27] While mathematical criteria provide an objective and quantitative method for data rejection, they do not make the practice more scientifically or methodologically sound, especially in small sets or where a normal distribution cannot be assumed.
The two common approaches to exclude outliers are truncation (or trimming) and Winsorising.
[29] In regression problems, an alternative approach may be to only exclude points which exhibit a large degree of influence on the estimated coefficients, using a measure such as Cook's distance.
The possibility should be considered that the underlying distribution of the data is not approximately normal, having "fat tails".