In mathematics and physics, Penrose graphical notation or tensor diagram notation is a (usually handwritten) visual depiction of multilinear functions or tensors proposed by Roger Penrose in 1971.
[1] A diagram in the notation consists of several shapes linked together by lines.
The notation has been studied extensively by Predrag Cvitanović, who used it, along with Feynman's diagrams and other related notations in developing "birdtracks", a group-theoretical diagram to classify the classical Lie groups.
[2] Penrose's notation has also been generalized using representation theory to spin networks in physics, and with the presence of matrix groups to trace diagrams in linear algebra.
The lines attached to shapes represent the inputs or outputs of a function, and attaching shapes together in some way is essentially the composition of functions.
Connecting lines between two shapes corresponds to contraction of indices.
Contraction of indices is represented by joining the index lines together.
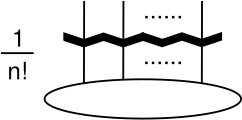
Symmetrization of indices is represented by a thick zigzag or wavy bar crossing the index lines horizontally.
The Ricci and Bianchi identities given in terms of the Riemann curvature tensor illustrate the power of the notation The notation has been extended with support for spinors and twistors.
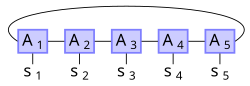
Penrose graphical notation (tensor diagram notation) of a
matrix product state
of five particles


![{\displaystyle {}_{Q^{ab}=Q^{[ab]}+Q^{(ab)}}}](https://wikimedia.org/api/rest_v1/media/math/render/svg/dfe6141e87f3bb6bf46b13e6f0df759f36dcf68c)

![{\displaystyle E_{[ab\ldots n]}}](https://wikimedia.org/api/rest_v1/media/math/render/svg/58adc5ba5ef08561356cd95bb5819fe124ee5f66)
![{\displaystyle {}_{E_{ab}=E_{[ab]}+E_{(ab)}}}](https://wikimedia.org/api/rest_v1/media/math/render/svg/c80d0cf553b08549782f76dccacdb1d217343cb7)


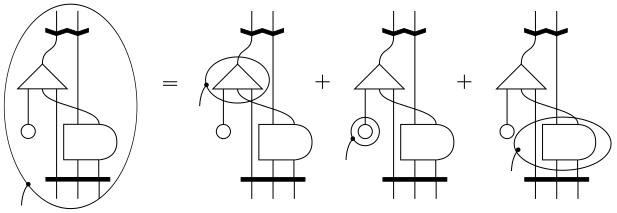
![{\displaystyle 12\nabla _{a}\left(\xi ^{f}\,\lambda _{fb[c}^{(d}\,D_{gh]}^{e)b}\right)}](https://wikimedia.org/api/rest_v1/media/math/render/svg/19303966fb76867c7c27fdfa2e39de87ca0b4a48)
![{\displaystyle =12\left(\xi ^{f}(\nabla _{a}\lambda _{fb[c}^{(d})\,D_{gh]}^{e)b}+(\nabla _{a}\xi ^{f})\lambda _{fb[c}^{(d}\,D_{gh]}^{e)b}+\xi ^{f}\lambda _{fb[c}^{(d}\,(\nabla _{a}D_{gh]}^{e)b})\right)}](https://wikimedia.org/api/rest_v1/media/math/render/svg/a82bab6d232355cfdc3add53ebabeb01ccd571e6)


![{\displaystyle \nabla _{[a}R_{bc]d}^{\ \ \ e}=0}](https://wikimedia.org/api/rest_v1/media/math/render/svg/3896d2dbc992145ed836177f508a50380f70d023)