Phase noise
In signal processing, phase noise is the frequency-domain representation of random fluctuations in the phase of a waveform, corresponding to time-domain deviations from perfect periodicity (jitter).
Generally speaking, radio-frequency engineers speak of the phase noise of an oscillator, whereas digital-system engineers work with the jitter of a clock.
An ideal oscillator would generate a pure sine wave.
All real oscillators have phase modulated noise components.
The phase noise components spread the power of a signal to adjacent frequencies, resulting in noise sidebands.
, possess different power Spectral density (PSD).
, given by the Fourier transform of the Autocorrelation of the phase noise.
Phase noise is sometimes also measured and expressed as a power obtained by integrating ℒ(f) over a certain range of offset frequencies.
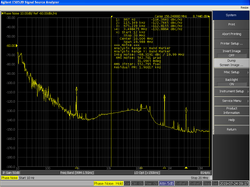
This integrated phase noise (expressed in degrees) can be converted to jitter (expressed in seconds) using the following formula: In the absence of 1/f noise in a region where the phase noise displays a –20 dBc/decade slope (Leeson's equation), the RMS cycle jitter can be related to the phase noise by:[2] Likewise: Phase noise can be measured using a spectrum analyzer if the phase noise of the device under test (DUT) is large with respect to the spectrum analyzer's local oscillator.
Care should be taken that observed values are due to the measured signal and not the shape factor of the spectrum analyzer's filters.
Spectrum analyzer based measurement can show the phase-noise power over many decades of frequency; e.g., 1 Hz to 10 MHz.
The slope with offset frequency in various offset frequency regions can provide clues as to the source of the noise; e.g., low frequency flicker noise decreasing at 30 dB per decade (= 9 dB per octave).
[3] Phase noise measurement systems are alternatives to spectrum analyzers.
These systems may use internal and external references and allow measurement of both residual (additive) and absolute noise.
Additionally, these systems can make low-noise, close-to-the-carrier, measurements.
The sinusoidal output of an ideal oscillator is a Dirac delta function in the power spectral density centered at the frequency of the sinusoid.
Such perfect spectral purity is not achievable in a practical oscillator.
Spreading of the spectrum line caused by phase noise is characterized by the fundamental linewidth and the integral linewidth.
The fundamental linewidth takes Lorentzian spectral line shape.
Allan Deviation plot at small averaging times.
Allan Deviation plot at moderate averaging times.
This flat line on the Allan Deviation plot is also known as the flicker floor.
Additionally, the oscillator might experience Frequency drift over long periods of time, slowly moving the center frequency of the Voigt lineshape.
Allan Deviation plot at large averaging times.
Lasers with a near-Infrared center wavelength are used in many atomic, molecular, and optical physics experiments to provide photons that interact with atoms.