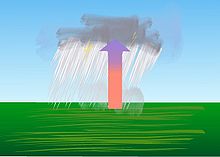
Rain
Elevated portions of weather fronts (which are three-dimensional in nature)[17] force broad areas of upward motion within the Earth's atmosphere which form clouds decks such as altostratus or cirrostratus.
As these larger water droplets descend, coalescence continues, so that drops become heavy enough to overcome air resistance and fall as rain.
[32] Rain falling on loosely packed material such as newly fallen ash can produce dimples that can be fossilized, called raindrop impressions.
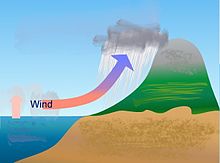
Moisture is removed by orographic lift, leaving drier air (see katabatic wind) on the descending and generally warming, leeward side where a rain shadow is observed.
[46] Local climates vary considerably on each island due to their topography, divisible into windward (Koʻolau) and leeward (Kona) regions based upon location relative to the higher mountains.
[47] In South America, the Andes mountain range blocks Pacific moisture that arrives in that continent, resulting in a desert-like climate just downwind across western Argentina.
[48] The Sierra Nevada range creates the same effect in North America forming the Great Basin and Mojave Deserts.
In heavily populated areas that are near the coast, such as the United States' Eastern Seaboard, the effect can be dramatic: there is a 22% higher chance of rain on Saturdays than on Mondays.
Partly as a result of this warming, monthly rainfall is about 28% greater between 32 and 64 km (20 and 40 mi) downwind of cities, compared with upwind.
[66][67] The most successful attempts at influencing weather involve cloud seeding, which include techniques used to increase winter precipitation over mountains and suppress hail.
The front creates the portion of an occluded cyclone known as its comma head, due to the comma-like shape of the mid-tropospheric cloudiness that accompanies the feature.
[77] Behind extratropical cyclones during fall and winter, rainbands can form downwind of relative warm bodies of water such as the Great Lakes.
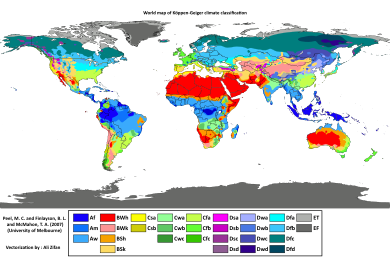
[85] The humid subtropical climate zone is where winter rainfall is associated with large storms that the westerlies steer from west to east.
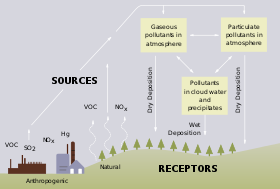
[91] In 2022, levels of at least four perfluoroalkyl acids (PFAAs) in rain water worldwide greatly exceeded the EPA's lifetime drinking water health advisories as well as comparable Danish, Dutch, and European Union safety standards, leading to the conclusion that "the global spread of these four PFAAs in the atmosphere has led to the planetary boundary for chemical pollution being exceeded".
[112] For instance, river flood control, sewer management and dam construction are all areas where planners use rainfall accumulation data.
[115] The following categories are used to classify rainfall intensity: Terms used for a heavy or violent rain include gully washer, trash-mover and toad-strangler.
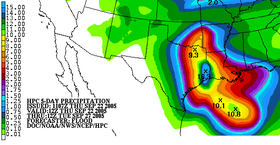
[124] Starting in the mid to late 1990s, QPFs were used within hydrologic forecast models to simulate impact to rivers throughout the United States.
Drought can kill crops and increase erosion,[129] while overly wet weather can cause harmful fungus growth.
For example, certain cacti require small amounts of water,[131] while tropical plants may need up to hundreds of inches of rain per year to survive.
In temperate climates, people tend to be more stressed when the weather is unstable or cloudy, with its impact greater on men than women.
[144] In his Meditations, the Roman emperor Marcus Aurelius preserves a prayer for rain made by the Athenians to the Greek sky god Zeus.
In South America, the Andes mountain range blocks Pacific moisture that arrives in that continent, resulting in a desert-like climate just downwind across western Argentina.
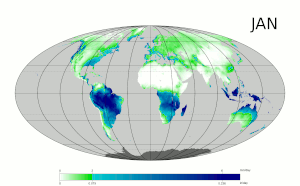
The equatorial region near the Intertropical Convergence Zone (ITCZ), or monsoon trough, is the wettest portion of the world's continents.
Its poleward progression is accelerated by the onset of the summer monsoon, which is characterized by the development of lower air pressure (a thermal low) over the warmest part of Asia.
[158] The eastern half of the contiguous United States east of the 98th meridian, the mountains of the Pacific Northwest, and the Sierra Nevada range are the wetter portions of the nation, with average rainfall exceeding 760 mm (30 in) per year.
Large thunderstorm areas known as mesoscale convective complexes move through the Plains, Midwest, and Great Lakes during the warm season, contributing up to 10% of the annual precipitation to the region.
[163] The El Niño-Southern Oscillation affects the precipitation distribution by altering rainfall patterns across the western United States,[164] Midwest,[165][166] the Southeast,[167] and throughout the tropics.
There is also evidence that global warming leads to increased precipitation in the eastern portions of North America, while droughts are becoming more frequent in the tropics and subtropics.
Cherrapunji, situated on the southern slopes of the Eastern Himalaya in Shillong, India is the confirmed wettest place on Earth, with an average annual rainfall of 11,430 mm (450 in).
Lloró, a town situated in Chocó, Colombia, is probably the place with the largest rainfall in the world, averaging 13,300 mm (523.6 in) per year.


- Contrary to popular belief, raindrops are never tear-shaped.
- Very small raindrops are almost spherical.
- Larger raindrops become flattened at the bottom due to air resistance.
- Large raindrops have a large amount of air resistance, and begin to become unstable.
- Very large raindrops split into smaller raindrops due to air resistance.