Best response
Response correspondences for all 2 × 2 normal form games can be drawn with a line for each player in a unit square strategy space.
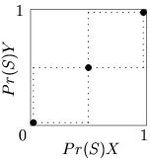
In Figure 2 the dotted line shows the optimal probability that player X plays 'Stag' (shown in the x-axis), as a function of the probability that player Y plays Stag (shown in the y-axis).
Note that Figure 2 plots the independent and response variables in the opposite axes to those normally used, so that it may be superimposed onto the previous graph, to show the Nash equilibria at the points where the two player's best responses agree in Figure 3.
They have reaction correspondences (Figure 4) that cross in the opposite direction to coordination games, with three Nash equilibria, one in each of the top left and bottom right corners, where one player chooses one strategy, the other player chooses the opposite strategy.
The third Nash equilibrium is a mixed strategy which lies along the diagonal from the bottom left to top right corners.
If the players do not know which one of them is which, then the mixed Nash is an evolutionarily stable strategy (ESS), as play is confined to the bottom left to top right diagonal line.
If the dimensions were defined as "Probability play Defect", then both players best response curves would be 1 for all opponent strategy probabilities and the reaction correspondences would cross (and form a Nash equilibrium) at the top right corner.
A wider range of reaction correspondences shapes is possible in 2 × 2 games with payoff asymmetries.
The dimensions may be redefined (exchange names of strategies 1 and 2) to produce symmetrical games which are logically identical.
The only Nash equilibrium is the combination of mixed strategies where both players independently choose heads and tails with probability 0.5 each.
Players do not consider the effect that choosing a strategy on the next round would have on future play in the game.
In smoothed best response as the difference between two actions decreases the individual's play approaches 50:50.
First, it is consistent with psychological experiments; when individuals are roughly indifferent between two actions they appear to choose more or less at random.