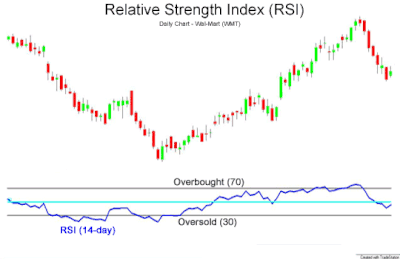
Relative strength index
The relative strength index (RSI) is a technical indicator used in the analysis of financial markets.
It is intended to chart the current and historical strength or weakness of a stock or market based on the closing prices of a recent trading period.
The RSI is classified as a momentum oscillator, measuring the velocity and magnitude of price movements.
The RSI computes momentum as the ratio of higher closes to overall closes: stocks which have had more or stronger positive changes have a higher RSI than stocks which have had more or stronger negative changes.
The RSI is most typically used on a 14-day timeframe, measured on a scale from 0 to 100, with high and low levels marked at 70 and 30, respectively.
High and low levels—80 and 20, or 90 and 10—occur less frequently but indicate stronger momentum.
The relative strength index was developed by J. Welles Wilder and published in a 1978 book, New Concepts in Technical Trading Systems, and in Commodities magazine (now Modern Trader magazine) in the June 1978 issue.
[2] The RSI provides signals that tell investors to buy when the security or currency is oversold and to sell when it is overbought.
[3] RSI with recommended parameters and its day-to-day optimization was tested and compared with other strategies in Marek and Šedivá (2017).
The testing was randomised in time and companies (e.g., Apple, Exxon Mobil, IBM, Microsoft) and showed that RSI can still produce good results; however, in longer time it is usually overcome by the simple buy-and-hold strategy.
Wilder originally formulated the calculation of the moving average as: newval = (prevval * (n - 1) + newdata) / n, which is equivalent to the aforementioned exponential smoothing.
Wilder posited[1] that when price moves up very rapidly, at some point it is considered overbought.
Likewise, when price falls very rapidly, at some point it is considered oversold.
In either case, Wilder deemed a reaction or reversal imminent.
The level of the RSI is a measure of the stock's recent trading strength.
The slope of the RSI is directly proportional to the velocity of a change in the trend.
The distance traveled by the RSI is proportional to the magnitude of the move.
Wilder believed that tops and bottoms are indicated when RSI goes above 70 or drops below 30.
Traditionally, RSI readings greater than the 70 level are considered to be in overbought territory, and RSI readings lower than the 30 level are considered to be in oversold territory.
[5] Wilder further believed that divergence between RSI and price action is a very strong indication that a market turning point is imminent.
[1]: 68 Furthermore, traders often use "hidden" divergences to indicate possible trend reversals.
[citation needed] Wilder thought that "failure swings" above 50 and below 50 on the RSI are strong indications of market reversals.
Cardwell observed when securities change from uptrend to downtrend and vice versa, the RSI will undergo a "range shift."
Next, Cardwell noted that bearish divergence: 1) only occurs in uptrends, and 2) mostly only leads to a brief correction instead of a reversal in trend.
Similarly, bullish divergence is a sign confirming a downtrend.
Finally, Cardwell discovered the existence of positive and negative reversals in the RSI.
In other words, despite stronger momentum as seen by the higher high or lower low in the RSI, price could not make a higher high or lower low.
Cutler had found that since Wilder used a smoothed moving average to calculate RSI, the value of Wilder's RSI depended upon where in the data file his calculations started.
is a quotient of two integrals and is a value that assigns a weight to the part of
, multiplied by an exponential factor according to the SMMA weighting for that time.


