Riemann sum
It is named after nineteenth century German mathematician Bernhard Riemann.
One very common application is in numerical integration, i.e., approximating the area of functions or lines on a graph, where it is also known as the rectangle rule.
The sum is calculated by partitioning the region into shapes (rectangles, trapezoids, parabolas, or cubics—sometimes infinitesimally small) that together form a region that is similar to the region being measured, then calculating the area for each of these shapes, and finally adding all of these small areas together.
This approach can be used to find a numerical approximation for a definite integral even if the fundamental theorem of calculus does not make it easy to find a closed-form solution.
[1] One might produce different Riemann sums depending on which
In the end this will not matter, if the function is Riemann integrable, when the difference or width of the summands
give different types of Riemann sums: All these Riemann summation methods are among the most basic ways to accomplish numerical integration.
It is one of the simplest of a very general way of approximating integrals using weighted averages.
) is contained between the lower and upper Darboux sums.
The four Riemann summation methods are usually best approached with subintervals of equal size.
This gives multiple rectangles with base Δx and height f(a + iΔx).
For the right rule, the function is approximated by its values at the right endpoints of the subintervals.
This gives multiple rectangles with base Δx and height f(a + iΔx).
Therefore, we can apply this generalized midpoint integration formula by assuming that
For the trapezoidal rule, the function is approximated by the average of its values at the left and right endpoints of the subintervals.
for a trapezium with parallel sides b1 and b2, and height h, and summing the resulting areas gives
This limiting value, if it exists, is defined as the definite Riemann integral of the function over the domain,
The following animations help demonstrate how increasing the number of subintervals (while lowering the maximum subinterval size) better approximates the "area" under the curve: Since the red function here is assumed to be a smooth function, all three Riemann sums will converge to the same value as the number of subintervals goes to infinity.
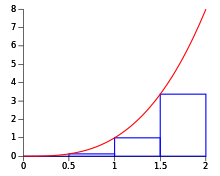
Taking an example, the area under the curve y = x2 over [0, 2] can be procedurally computed using Riemann's method.
Because the right Riemann sum is to be used, the sequence of x coordinates for the boxes will be
If the limit is viewed as n → ∞, it can be concluded that the approximation approaches the actual value of the area under the curve as the number of boxes increases.
This method agrees with the definite integral as calculated in more mechanical ways:
Because the function is continuous and monotonically increasing over the interval, a right Riemann sum overestimates the integral by the largest amount (while a left Riemann sum would underestimate the integral by the largest amount).
This fact, which is intuitively clear from the diagrams, shows how the nature of the function determines how accurate the integral is estimated.
While simple, right and left Riemann sums are often less accurate than more advanced techniques of estimating an integral such as the Trapezoidal rule or Simpson's rule.
The example function has an easy-to-find anti-derivative so estimating the integral by Riemann sums is mostly an academic exercise; however it must be remembered that not all functions have anti-derivatives so estimating their integrals by summation is practically important.
This can be generalized to allow Riemann sums for functions over domains of more than one dimension.
Higher dimensional Riemann sums follow a similar pattern.
In high generality, Riemann sums can be written
stands for any arbitrary point contained in the set