Simpson's paradox
This result is often encountered in social-science and medical-science statistics,[1][2][3] and is particularly problematic when frequency data are unduly given causal interpretations.
[4] The paradox can be resolved when confounding variables and causal relations are appropriately addressed in the statistical modeling[4][5] (e.g., through cluster analysis[6]).
Simpson's paradox has been used to illustrate the kind of misleading results that the misuse of statistics can generate.
[7][8] Edward H. Simpson first described this phenomenon in a technical paper in 1951,[9] but the statisticians Karl Pearson (in 1899[10]) and Udny Yule (in 1903[11]) had mentioned similar effects earlier.
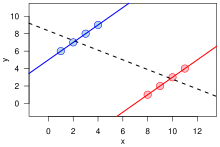
[13] Mathematician Jordan Ellenberg argues that Simpson's paradox is misnamed as "there's no contradiction involved, just two different ways to think about the same data" and suggests that its lesson "isn't really to tell us which viewpoint to take but to insist that we keep both the parts and the whole in mind at once.
"[14] One of the best-known examples of Simpson's paradox comes from a study of gender bias among graduate school admissions to University of California, Berkeley.
The admission figures for the fall of 1973 showed that men applying were more likely than women to be admitted, and the difference was so large that it was unlikely to be due to chance.
The pooled and corrected data showed a "small but statistically significant bias in favor of women".
[16] Another example comes from a real-life medical study[17] comparing the success rates of two treatments for kidney stones.
[citation needed] Which treatment is considered better is determined by which success ratio (successes/total) is larger.
[19] A common example of Simpson's paradox involves the batting averages of players in professional baseball.
Mathematician Ken Ross demonstrated this using the batting average of two baseball players, Derek Jeter and David Justice, during the years 1995 and 1996:[20][21] In both 1995 and 1996, Justice had a higher batting average (in bold type) than Jeter did.
However, when the two baseball seasons are combined, Jeter shows a higher batting average than Justice.
Berman et al.[23] give an example from economics, where a dataset suggests overall demand is positively correlated with price (that is, higher prices lead to more demand), in contradiction of expectation.
Psychological interest in Simpson's paradox seeks to explain why people[who?]
[clarification needed] The question is where people get this strong intuition from, and how it is encoded in the mind.
Simpson's paradox demonstrates that this intuition cannot be derived from either classical logic or probability calculus alone, and thus led philosophers to speculate that it is supported by an innate causal logic that guides people in reasoning about actions and their consequences.
A qualified version of Savage's sure thing principle can indeed be derived from Pearl's do-calculus[4] and reads: "An action A that increases the probability of an event B in each subpopulation Ci of C must also increase the probability of B in the population as a whole, provided that the action does not change the distribution of the subpopulations."
This suggests that knowledge about actions and consequences is stored in a form resembling Causal Bayesian Networks.
A paper by Pavlides and Perlman presents a proof, due to Hadjicostas, that in a random 2 × 2 × 2 table with uniform distribution, Simpson's paradox will occur with a probability of exactly 1⁄60.
[26] Judea Pearl has shown that, in order for the partitioned data to represent the correct causal relationships between any two variables,
, the partitioning variables must satisfy a graphical condition called "back-door criterion":[27][28] This criterion provides an algorithmic solution to Simpson's second paradox, and explains why the correct interpretation cannot be determined by data alone; two different graphs, both compatible with the data, may dictate two different back-door criteria.
When the back-door criterion is satisfied by a set Z of covariates, the adjustment formula (see Confounding) gives the correct causal effect of X on Y.
If no such set exists, Pearl's do-calculus can be invoked to discover other ways of estimating the causal effect.
[31] Another criticism of the apparent Simpson's paradox is that it may be a result of the specific way that data are stratified or grouped.
Simpson's example actually highlighted a phenomenon called noncollapsibility,[32] which occurs when subgroups with high proportions do not make simple averages when combined.
This suggests that the paradox may not be a universal phenomenon, but rather a specific instance of a more general statistical issue.
Critics of the apparent Simpson's paradox also argue that the focus on the paradox may distract from more important statistical issues, such as the need for careful consideration of confounding variables and causal relationships when interpreting data.
[33] Despite these criticisms, the apparent Simpson's paradox remains a popular and intriguing topic in statistics and data analysis.
It continues to be studied and debated by researchers and practitioners in a wide range of fields, and it serves as a valuable reminder of the importance of careful statistical analysis and the potential pitfalls of simplistic interpretations of data.