State diagram
A state diagram is used in computer science and related fields to describe the behavior of systems.
State diagrams provide an abstract description of a system's behavior.
This behavior is analyzed and represented by a series of events that can occur in one or more possible states.
[1] State diagrams can be used to graphically represent finite-state machines (also called finite automata).
This was introduced by Claude Shannon and Warren Weaver in their 1949 book The Mathematical Theory of Communication.
Another source is Taylor Booth in his 1967 book Sequential Machines and Automata Theory.
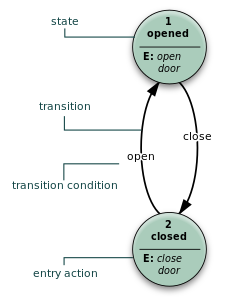
A classic form of state diagram for a finite automaton (FA) is a directed graph with the following elements (Q, Σ, Z, δ, q0, F):[2][3] The output function ω represents the mapping of ordered pairs of input symbols and states onto output symbols, denoted mathematically as ω : Σ × Q→ Z.
[non-primary source needed] The diagram type allows the modeling of superstates, orthogonal regions, and activities as part of a state.
The Harel statechart is equivalent to a state diagram but improves its readability.
A state machine (panel (a)) performs actions in response to explicit events.
Now consider the full case, when variables exist and are affected by the program commands being executed.
Although the do loop executes the same increment command iteratively, its state space is not a cycle but a line.
This results from the state being the program location (here cycling) combined with the counter value, which is strictly increasing (until the overflow).
The figure above attempts to show that reversal of roles by aligning the arcs of the state diagrams with the processing stages of the flowchart.
One can compare a flowchart to an assembly line in manufacturing because the flowchart describes the progression of some task from beginning to end (e.g., transforming source code input into object code output by a compiler).