Student's t-test
In many cases, a Z-test will yield very similar results to a t-test because the latter converges to the former as the size of the dataset increases.
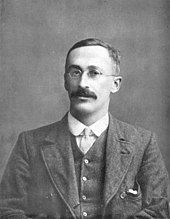
[8] However, the t-distribution, also known as Student's t-distribution, gets its name from William Sealy Gosset, who first published it in English in 1908 in the scientific journal Biometrika using the pseudonym "Student"[9][10] because his employer preferred staff to use pen names when publishing scientific papers.
Hence a second version of the etymology of the term Student is that Guinness did not want their competitors to know that they were using the t-test to determine the quality of raw material.
[9] Guinness had a policy of allowing technical staff leave for study (so-called "study leave"), which Gosset used during the first two terms of the 1906–1907 academic year in Professor Karl Pearson's Biometric Laboratory at University College London.
[14] A one-sample Student's t-test is a location test of whether the mean of a population has a value specified in a null hypothesis.
In testing the null hypothesis that the population mean is equal to a specified value μ0, one uses the statistic where
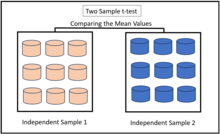
A two-sample location test of the null hypothesis such that the means of two populations are equal.
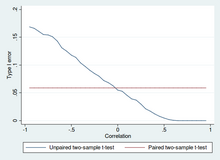
Paired t-tests are a form of blocking, and have greater power (probability of avoiding a type II error, also known as a false negative) than unpaired tests when the paired units are similar with respect to "noise factors" (see confounder) that are independent of membership in the two groups being compared.
[16] In a different context, paired t-tests can be used to reduce the effects of confounding factors in an observational study.
That way the correct rejection of the null hypothesis (here: of no difference made by the treatment) can become much more likely, with statistical power increasing simply because the random interpatient variation has now been eliminated.
Pairs become individual test units, and the sample has to be doubled to achieve the same number of degrees of freedom.
In each case, the formula for a test statistic that either exactly follows or closely approximates a t-distribution under the null hypothesis is given.
The t statistic to test whether the means are different can be calculated as follows: where Here sp is the pooled standard deviation for n = n1 = n2, and s 2X1 and s 2X2 are the unbiased estimators of the population variance.
The t statistic to test whether the population means are different is calculated as where Here si2 is the unbiased estimator of the variance of each of the two samples with ni = number of participants in group i (i = 1 or 2).
The true distribution of the test statistic actually depends (slightly) on the two unknown population variances (see Behrens–Fisher problem).
We will carry out tests of the null hypothesis that the means of the populations from which the two samples were taken are equal.
(Welch's t-test is a nearly exact test for the case where the data are normal but the variances may differ.)
[19] If the data are substantially non-normal and the sample size is small, the t-test can give misleading results.
However, when data are non-normal with differing variances between groups, a t-test may have better type-1 error control than some non-parametric alternatives.
[19] For example, Mann-Whitney U test will keep the type 1 error at the desired level alpha if both groups have the same distribution.
In such cases, MW could have more than alpha level power in rejecting the Null hypothesis but attributing the interpretation of difference in means to such a result would be incorrect.
[19] One-way analysis of variance (ANOVA) generalizes the two-sample t-test when the data belong to more than two groups.
Alternatively making use of all of the available data, assuming normality and MCAR, the generalized partially overlapping samples t-test could be used.
Because measures of this type are usually positively correlated, it is not advisable to conduct separate univariate t-tests to test hypotheses, as these would neglect the covariance among measures and inflate the chance of falsely rejecting at least one hypothesis (Type I error).
At the end of treatment, the researchers measure the change from baseline in the number of words that each patient can recall in a memory test.
Data and code are given for the analysis using the R programming language with the t.test and lmfunctions for the t-test and linear regression.
Notice that the assumption of equal variance, var.equal=T, is required to make the analysis exactly equivalent to simple linear regression.
The coefficients for the linear regression specify the slope and intercept of the line that joins the two group means, as illustrated in the graph.
Including such additional explanatory variables using regression or anova reduces the otherwise unexplained variance, and commonly yields greater power to detect differences than do two-sample t-tests.
Many spreadsheet programs and statistics packages, such as QtiPlot, LibreOffice Calc, Microsoft Excel, SAS, SPSS, Stata, DAP, gretl, R, Python, PSPP, Wolfram Mathematica, MATLAB and Minitab, include implementations of Student's t-test.