Tanabe–Sugano diagram
The results from a Tanabe–Sugano diagram analysis of a metal complex can also be compared to experimental spectroscopic data.
They used Hans Bethe's crystal field theory and Giulio Racah's linear combinations of Slater integrals,[1] now called Racah parameters, to explain the absorption spectra of octahedral complex ions in a more quantitative way than had been achieved previously.
[2] Many spectroscopic experiments later, they estimated the values for two of Racah's parameters, B and C, for each d-electron configuration based on the trends in the absorption spectra of isoelectronic first-row transition metals.
[3][4] Number must be fit for each octahedral coordination complex because the C/B can deviate strongly from the theoretical value of 4.0.
A is constant among d-electron configuration, and it is not necessary for calculating relative energies, hence its absence from Tanabe and Sugano's studies of complex ions.
for a specific dn free ion are listed, in order of increasing energy, on the y-axis of the diagram.
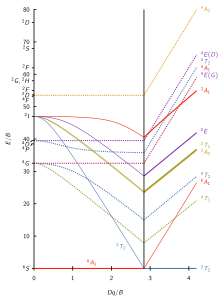
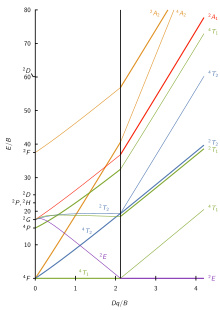
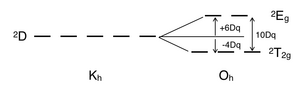
For an octahedral complex, the spherical, free ion term symbols split accordingly:[9] Certain Tanabe–Sugano diagrams (d4, d5, d6, and d7) also have a vertical line drawn at a specific Dq/B value, which is accompanied by a discontinuity in the slopes of the excited states' energy levels.
This pucker in the lines occurs when the identity of the ground state changes, shown in the diagram below.
There is no low-spin or high-spin designation for d2, d3, or d8 because none of the states cross at reasonable crystal field energies.
A d1 octahedral metal complex, such as [Ti(H2O)6]3+, shows a single absorption band in a UV-vis experiment.
The prominent shoulder in this absorption band is due to a Jahn–Teller distortion which removes the degeneracy of the two 2Eg states.
A consequence of the much smaller size of ΔT results in (almost) all tetrahedral complexes being high spin and therefore the change in the ground state term seen on the X-axis for octahedral d4-d7 diagrams is not required for interpreting spectra of tetrahedral complexes.
The restriction of the spin selection rule makes it even easier to predict the possible transitions and their relative intensity.
Although they are qualitative, Tanabe–Sugano diagrams are very useful tools for analyzing UV-vis spectra: they are used to assign bands and calculate Dq values for ligand field splitting.
H2O is a weak field ligand (spectrum shown below), and according to the Tanabe–Sugano diagram for d5 ions, the ground state is 6A1.
From the high-spin (left) side of the d7 Tanabe–Sugano diagram, the ground state is 4T1(F), and the spin multiplicity is a quartet.
Based on the T–S diagram, the lowest energy transition is 4T1 to 4T2, which is seen in the near IR and is not observed in the visible spectrum.