World economy
It is common to limit questions of the world economy exclusively to human economic activity, and the world economy is typically judged in monetary terms, even in cases in which there is no efficient market to help valuate certain goods or services, or in cases in which a lack of independent research, genuine data or government cooperation makes calculating figures difficult.
However, even in cases in which there is a clear and efficient market to establish monetary value, economists do not typically use the current or official exchange rate to translate the monetary units of this market into a single unit for the world economy since exchange rates typically do not closely reflect worldwide value – for example, in cases where the volume or price of transactions is closely regulated by the government.
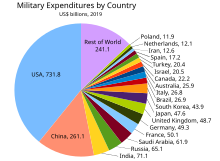
As of 2024, the following 20 countries or collectives have reached an economy of at least US$2 trillion by Gross Domestic Product (GDP) in nominal or Purchasing Power Parity (PPP) terms: Brazil, Canada, China, Egypt, France, Germany, India, Indonesia, Italy, Japan, Mexico, South Korea, Russia, Saudi Arabia, Spain, Turkey, the United Kingdom, the United States, the European Union and the African Union.
The index includes 11 comparable "dimensions" of well-being:[65] To promote exports, many government agencies publish on the web economic studies by sector and country.
Through Partnership Agreements, the Federation of International Trade Associations publishes studies from several of these agencies (USCS, FAS, AAFC, UKTI, and HKTDC) as well as other non-governmental organizations on its website globaltrade.net.


|
>$60,000
$50,000 – $60,000
$40,000 – $50,000
$30,000 – $40,000
|
$20,000 – $30,000
$10,000 – $20,000
$5,000 – $10,000
$2,500 – $5,000
|
$1,000 – $2,500
<$1,000
No data
|