Three-phase traffic theory
Thus the term wide has nothing to do with the width across the jam, but actually refers to its length being considerably more than the transition zones at its head and tail.
(ii) There is a tendency towards synchronization of vehicle speeds across different lanes on a multilane road in this flow.
One pattern propagates upstream with an almost constant velocity of the downstream front, moving straight through the freeway bottleneck.
However, there are local microscopic criteria for the distinction between the phases J and S without a study of the propagation of congested traffic through a bottleneck.
2.6 in the book[5]): If in single-vehicle (microscopic) data related to congested traffic the "flow-interruption interval", i.e., a time headway between two vehicles following each other is observed, which is much longer than the mean time delay in vehicle acceleration from a wide moving jam (the latter is about 1.3–2.1 s), then the related flow-interruption interval corresponds to the wide moving jam phase.
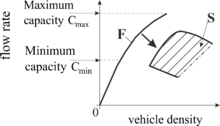
Kerner’s hypothesis is that homogeneous synchronized flow can occur anywhere in a two-dimensional region (2D) of the flow-density plane (2D-region S in Figure 4(a)).
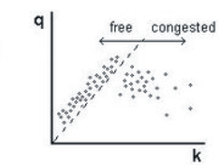
[9] In measured data, congested traffic most often occurs in the vicinity of highway bottlenecks, e.g., on-ramps, off-ramps, or roadwork.
This implies that a spontaneous F → S phase transition occurs through the growth of an internal disturbance in free flow in a neighbourhood of a bottleneck.
(ii) Probability of this spontaneous traffic breakdown is an increasing function of the flow rates at the bottleneck.
2.2.3 and 3.1 of the book[5]); for this reason, the F → S phase transition occurs in a metastable free flow at a highway bottleneck.
Such a disturbance that initiates the F → S phase transition in metastable free flow at the bottleneck can be called a nucleus for traffic breakdown.
In other words, real traffic breakdown (F → S phase transition) at a highway bottleneck exhibits the nucleation nature.
The search for an explanation of the empirical nucleation nature of traffic breakdown (F → S phase transition) at a highway bottleneck has been the motivation for the development of Kerner’s three-phase theory.
Kerner developed the three-phase theory as an explanation of the empirical nature of traffic breakdown at highway bottlenecks: a random (probabilistic) F → S phase transition that occurs in the metastable state of free flow.
Depending on traffic parameters like weather, percentage of long vehicles, et cetera, and characteristics of the bottleneck where the F → S phase transition can occur, the minimum capacity
The downstream front of synchronized flow is often spatially fixed (see definition [S]), normally at a bottleneck at a certain road location.
Because the synchronized flow phase does not have the characteristic features of the wide moving jam phase J, Kerner’s three-phase traffic theory assumes that the hypothetical homogeneous states of synchronized flow cover a two-dimensional region in the flow-density plane (dashed regions in Figure 8).
Thus, wide moving jams emerge later than traffic breakdown (F → S transition) has occurred and at another road location upstream of the bottleneck.
Therefore, when Kerner’s F → S → J phase transitions occurring in real traffic (Figure 9 (a)) are presented in the speed-density plane (Figure 9 (b)) (or speed-flow, or else flow-density planes), one should remember that states of synchronized flow and low speed state within a wide moving jam are measured at different road locations.
To further illustrate S → J phase transitions: in Kerner’s three-phase traffic theory Line J divides the homogeneous states of synchronized flow in two (Figure 8).
Metastable homogeneous synchronized flow means that for small disturbances, the traffic state remains stable.
The difference between the SP and the wide moving jam becomes visible in that when a WSP or MSP reaches an upstream bottleneck the so-called "catch-effect" can occur.
ASDA/FOTO is a software tool able to process large traffic data volumes quickly and efficiently on freeway networks (see examples from three countries, Figure 11).
It can be expected that a diverse variety of different mathematical models of traffic flow can be developed in the framework of Kerner’s three-phase theory.
[17] The Kerner-Klenov stochastic three-phase traffic flow model in the framework of Kerner’s theory has further been developed for different applications.
Over time several scientific groups have developed new mathematical models in the framework of Kerner’s three-phase theory.
In particular, new mathematical models in the framework of Kerner’s three-phase theory have been introduced in the works by Jiang, Wu, Gao, et al.,[18][19] Davis,[20] Lee, Barlovich, Schreckenberg, and Kim[21] (see other references to mathematical models in the framework of Kerner’s three-phase traffic theory and results of their investigations in Sec.
Kerner uses fixed-point measurements (loop detectors), but draws his conclusions on vehicle trajectories, which span the whole length of the road under investigation.
Other criticisms have been made, such as that the notion of phases has not been well defined and that so-called two-phase models also succeed in simulating the essential features described by Kerner.
The most important feature of Kerner’s theory is the explanation of the empirical nucleation nature of traffic breakdown at a road bottleneck by the F → S transition.