Time–distance diagram
Such charts are used in the aviation industry to plot flights,[1] or in scientific research to present effects in respect to distance over time.
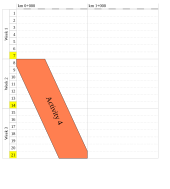
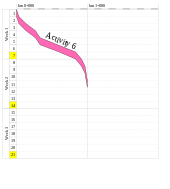
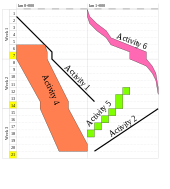
Activities can be presented as geometrical shapes showing the occupation of the work site over time such that conflicting access can be detected visually.
The background of the drawing area may be enhanced with time and location related information such as close seasons, hold-off intervals, meteorological data (rain/snow fall, temperatures).
Sometimes, spreadsheet tools are employed where the width of the columns and the height of the rows form the distance and time scales.
However, in real project life, a time schedule needs to be adjusted continuously: This is when the use of specialized tools quickly brings out their advantage.
Special features allow dependency links (with lags), complex scaling, access conflict detection, resource-dependent progress, and more.