Total operating characteristic
TOC can measure the ability of an index variable to diagnose either presence or absence of a characteristic.
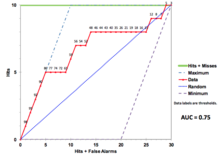
Each threshold generates a two-by-two contingency table, which contains four entries: hits, misses, false alarms, and correct rejections.
TOC is applicable to measure diagnostic ability in many fields including but not limited to: land change science, medical imaging, weather forecasting, remote sensing, and materials testing.
The contingency table that results from the comparison between the Boolean variable and the diagnosis for a single threshold has four central entries.
The four central entries are hits (H), misses (M), false alarms (F), and correct rejections (C).
The TOC curve is an effective way to show the total information in the contingency table for all thresholds.
The vertical axis ranges from 0 to 10, which is the Boolean variable's number of presence observations P (i.e. hits + misses).
TOC curves also show the threshold at which the diagnosed amount of presence matches the Boolean amount of presence, which is the threshold point that lies directly under the point where the maximum line meets the hits + misses line, as the TOC curve on the left illustrates.
However, condensing diagnostic ability into a single number fails to appreciate the shape of the curve.
[citation needed] This TOC curve on the left exemplifies an instance in which the index variable has a high diagnostic ability at high thresholds near the origin, but random diagnostic ability at low thresholds near the upper right of the curve.
[citation needed] This TOC curve exemplifies an instance in which the index variable has a medium diagnostic ability at all thresholds.
When using normalized units, the area under the curve (often referred to as simply the AUC) is equal to the probability that a classifier will rank a randomly chosen positive instance higher than a randomly chosen negative one (assuming 'positive' ranks higher than 'negative').
[6] This can be seen as follows: the area under the curve is given by (the integral boundaries are reversed as large T has a lower value on the x-axis) where
It can further be shown that the AUC is closely related to the Mann–Whitney U,[7][8] which tests whether positives are ranked higher than negatives.
It is also common to calculate the area under the TOC convex hull (ROC AUCH = ROCH AUC) as any point on the line segment between two prediction results can be achieved by randomly using one or the other system with probabilities proportional to the relative length of the opposite component of the segment.
[11] Another problem with TOC AUC is that reducing the TOC Curve to a single number ignores the fact that it is about the tradeoffs between the different systems or performance points plotted and not the performance of an individual system, as well as ignoring the possibility of concavity repair, so that related alternative measures such as informedness[citation needed] or DeltaP are recommended.
[citation needed] Whereas TOC AUC varies between 0 and 1 — with an uninformative classifier yielding 0.5 — the alternative measures known as informedness,[citation needed] Certainty [12] and Gini coefficient (in the single parameterization or single system case)[citation needed] all have the advantage that 0 represents chance performance whilst 1 represents perfect performance, and −1 represents the "perverse" case of full informedness always giving the wrong response.
[14] Bringing chance performance to 0 allows these alternative scales to be interpreted as Kappa statistics.
[16] For example, one could focus on the region of the curve with low false positive rate, which is often of prime interest for population screening tests.