Demographics of the United Kingdom
[12] The United Kingdom's population is predominantly White British (75.98% at the 2021 Census), but due to migration from Commonwealth nations, Britain has become ethnically diverse.
[14][15] Following the Roman withdrawal from Britain, Germanic tribes from continental Europe such as the Angles, Saxons and Jutes began a period of significant migration to the southeastern part of the island, notably bringing their language, Old English.
[9] Periods of instability over the 15th century such as the War of the Roses caused the population to, while grow, increase at a slowed pace.
[9] In Scotland, population growth was not to the same extent as it was in England, which resulted in being significantly lower in the late 17th and early 18th centuries, which is often ascribed to similar factors halting it such as a high mortality rate, especially for infants, and later marriage and childbearing patterns.
[9] Ireland on the other hand before the 19th century consistently had rapid population growth, which has been ascribed to higher fertility rates and earlier marriage than England.
[9][24] This slowed rate of growth for Scotland may be attributed to higher net emigration of Scottish people out of the nation, and two typhus epidemics in 1837 and 1847.
[26] General mortality was thought to have declined as well, especially after 1850 as well as an increased birth rate caused the English population to sustain itself in the second phase of the transition from 1750 to 1870.
[9] The end of the First World War and the loss of lives of troops, coupled with an influenza outbreak is estimated to have caused the death of upwards of 900,000 people in the United Kingdom.
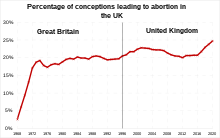
[9] For the first time in 1973, the birth rate of the country fell below replacement level, due to the previous liberalising acts.
There are 13 urban areas that exceed 500,000 inhabitants: they are centred on London, Birmingham, Glasgow, Leeds and Bradford, Southampton and Portsmouth, Sheffield, Liverpool, Leicester, Manchester, Belfast, Bristol, Newcastle-upon-Tyne and Nottingham.
[42][40][29][43][44] This transition represents the change in reproductive strategy from how many children a mother 'needs' to more of how many she 'wants' and a substitution of quality over quantity in the offspring produced.
[46] A number of factors have been argued to have contributed to this ranging from four broad spectrums of biological, technological changes and developments in the society, socio-economic reasons and cultural considerations.
[43] In the context of the Industrial Revolution, a large number of socio-economic developments occurred; large scale urbanisation of the population caused mass internal movements of people to high density population centres, income per capita of citizens rose significantly especially in the last half of the 19th century, coupled with large scale economic growth improved the livelihoods of the working and middle classes of the United Kingdom, this growth in the standard of living led also to the collapse of mortality rates, which had been in decline since the early 18th century and more especially the infant mortality.
[44][46][43] This development came about with the decline of child labour at the same time as well which meant there was less of a need for a quantity of children to uphold the household economically,[44][46][43] educational quality of the country rose during the same time period which meant that children held more economical potential through educated labour means.
[43] Cultural considerations such as decline in religious adherence (albeit little data on this matter during the 19th century) have also been considered as reasons.
[29] However compared to other countries in continental Western European standards, the United Kingdom managed to retain a seemingly 'high' fertility rate.
[29] Due to migration beginning in the late 90s and especially during the 2000s lead to the overall total fertility rate of the country to rise by 0.1 in the period of 2004 to 2011.
[40] The reduction of the total fertility rate of the United Kingdom has also had an effect on the mean age in which a mother gives birth to her first child.
[49] The reduction of the fertility rate has also had an effect on the general family size of mothers in the United Kingdom, with the two being interlinked with each other.
[49][54] Life expectancy has increased in the United Kingdom since the 18th century due to precipitate declines in child mortality, see below, and from relatively minor improvements in healthcare.
[63] There are two general lines of thought which are usually taken from into analysing the decline of infant mortality rates, the first line of thought comes from social historians, who ascribe the decline of infant mortality to social phenomenons of the time such as the need for a healthy population for the sake of the nation's fighting capabilities and political issues surrounding women.
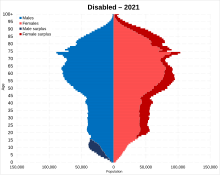
On the younger band of the population there is a noticeable gap between the ages of 14 and 20, this due to at the beginning of the 21st century a lower number of children being born (and a subsequent lower TFR), however in the years following the birth rate rose during the 2010s and a 'broadening' of the pyramid began for those in the younger years leading to more children in those age cohorts.
The current largest metropolitan areas are listed below:Rapid urbanisation began with the onset of the Industrial Revolution in the mid to late 18th century, shifting jobs and more importantly people away from rural Britain's dominance at the time which was primarily agricultural, to manufacturing jobs within urban areas which started to spring up.
By the end of the 20th century, London's ranking on the most populated cities of the world had fallen down to not even being in the top 20.
[87][88] Anything below that is classified as 'rural', having several levels of distinction to define a rural town and fringe, village or hamlet which is usually taken from population density figures.
[130][129] Through the 1970s, 80s and early 90s, net migration to the United Kingdom was often negative in terms of numbers, with more people leaving the country, than entering in total.
[29] Migration increased fourfold following the election of Tony Blair in 1997,[131][132] immigration restrictions were undone such as the primary purpose rule.
An example of recent large scale internal movement in the 21st century has been the departure of 220,000 White British Londoners to other areas of rural England and Wales over the 2000s[146] and over the 2010s around a total of 550,000 people left the city.
In 2010, academic David Coleman produced research postulating a future demographic decline of the White British in Britain, indicating that they would become a minority in Birmingham and London during the 2020s.
In Northern Ireland and parts of Western Scotland there are lingering sectarian divides between Roman Catholic and Protestant communities.