Voronoi diagram
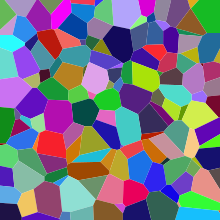
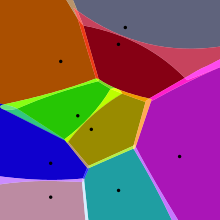
In mathematics, a Voronoi diagram is a partition of a plane into regions close to each of a given set of objects.
In the simplest case, these objects are just finitely many points in the plane (called seeds, sites, or generators).
[1][2][3] Voronoi diagrams have practical and theoretical applications in many fields, mainly in science and technology, but also in visual art.
[4][5] In the simplest case, shown in the first picture, we are given a finite set of points
, or equally distant, form a closed half-space, whose boundary is the perpendicular bisector of line segment
[6] When two cells in the Voronoi diagram share a boundary, it is a line segment, ray, or line, consisting of all the points in the plane that are equidistant to their two nearest sites.
The vertices of the diagram, where three or more of these boundaries meet, are the points that have three or more equally distant nearest sites.
be a tuple (indexed collection) of nonempty subsets (the sites) in the space
In the particular case where the space is a finite-dimensional Euclidean space, each site is a point, there are finitely many points and all of them are different, then the Voronoi cells are convex polytopes and they can be represented in a combinatorial way using their vertices, sides, two-dimensional faces, etc.
Sometimes the induced combinatorial structure is referred to as the Voronoi diagram.
Then, as expressed by Tran et al,[7] "all locations in the Voronoi polygon are closer to the generator point of that polygon than any other generator point in the Voronoi diagram in Euclidean plane".
As a simple illustration, consider a group of shops in a city.
can be used for giving a rough estimate on the number of potential customers going to this shop (which is modeled by a point in our city).
Informal use of Voronoi diagrams can be traced back to Descartes in 1644.
[10] Peter Gustav Lejeune Dirichlet used two-dimensional and three-dimensional Voronoi diagrams in his study of quadratic forms in 1850.
British physician John Snow used a Voronoi-like diagram in 1854 to illustrate how the majority of people who died in the Broad Street cholera outbreak lived closer to the infected Broad Street pump than to any other water pump.
Voronoi diagrams are named after Georgy Feodosievych Voronoy who defined and studied the general n-dimensional case in 1908.
[11] Voronoi diagrams that are used in geophysics and meteorology to analyse spatially distributed data are called Thiessen polygons after American meteorologist Alfred H. Thiessen, who used them to estimate rainfall from scattered measurements in 1911.
Certain body-centered tetragonal lattices give a tessellation of space with rhombo-hexagonal dodecahedra.
[12][13] The boundaries of the cells in the farthest-point Voronoi diagram have the structure of a topological tree, with infinite rays as its leaves.
A weighted Voronoi diagram is the one in which the function of a pair of points to define a Voronoi cell is a distance function modified by multiplicative or additive weights assigned to generator points.
A power diagram is a type of Voronoi diagram defined from a set of circles using the power distance; it can also be thought of as a weighted Voronoi diagram in which a weight defined from the radius of each circle is added to the squared Euclidean distance from the circle's center.
vertices, requiring the same bound for the amount of memory needed to store an explicit description of it.
Therefore, Voronoi diagrams are often not feasible for moderate or high dimensions.
[16] Voronoi diagrams are also related to other geometric structures such as the medial axis (which has found applications in image segmentation, optical character recognition, and other computational applications), straight skeleton, and zone diagrams.
It is used in meteorology and engineering hydrology to find the weights for precipitation data of stations over an area (watershed).
The points generating the polygons are the various station that record precipitation data.
The Jump Flooding Algorithm can generate approximate Voronoi diagrams in constant time and is suited for use on commodity graphics hardware.
These methods alternate between steps in which one constructs the Voronoi diagram for a set of seed points, and steps in which the seed points are moved to new locations that are more central within their cells.
These methods can be used in spaces of arbitrary dimension to iteratively converge towards a specialized form of the Voronoi diagram, called a Centroidal Voronoi tessellation, where the sites have been moved to points that are also the geometric centers of their cells.