Water footprint
A water footprint can be calculated for any well-defined group of consumers (e.g., an individual, family, village, city, province, state, or nation) or producers (e.g., a public organization, private enterprise, or economic sector), for a single process (such as growing rice) or for any product or service.
While this does provide valuable data, it is a limited way of looking at water use in a globalised world, in which products are not always consumed in their country of origin.
[3] The global issue of water footprinting underscores the importance of fair and sustainable resource management.
Thus, it gives a grasp on how economic choices and processes influence the availability of adequate water resources and other ecological realities across the globe (and vice versa).
[12] Cooperation between global leading institutions in the field has led to the establishment of the Water Footprint Network in 2008.
The network consists of around 100 partners from all sectors – producers, investors, suppliers and regulators – as well as non-governmental organisations and academics.
It describes its mission as follows: To provide science-based, practical solutions and strategic insights that empower companies, governments, individuals and small-scale producers to transform the way we use and share fresh water within earth's limits.
In July 2014, the International Organization for Standardization issued ISO 14046:2014, Environmental management—Water footprint—Principles, requirements and guidelines, to provide practical guidance to practitioners from various backgrounds, such as large companies, public authorities, non-governmental organizations, academic and research groups as well as small and medium enterprises, for carrying out a water footprint assessment.
The consideration of water consumption is crucial where water-intensive products (for example agricultural goods) are concerned that need to therefore undergo a life-cycle assessment.
In short, LCA is important as it identifies the impact of water use in certain products, consumers, companies, nations, etc.
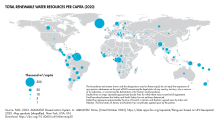
[17][18][19][20] Globally, about 4 percent of precipitation falling on land each year (about 117,000 km3 (28,000 cu mi)),[21] is used by rain-fed agriculture and about half is subject to evaporation and transpiration in forests and other natural or quasi-natural landscapes.
[22] The remainder, which goes to groundwater replenishment and surface runoff, is sometimes called "total actual renewable freshwater resources".
[24] Most agricultural use of withdrawn water is for irrigation, which uses about 5.1 percent of total actual renewable freshwater resources.
[29][clarification needed] The water footprints involved in various diets vary greatly, and much of the variation tends to be associated with levels of meat consumption.
[30] The following table gives examples of estimated global average water footprints of popular agricultural products.
The Carbon Trust argue that a more robust approach is for businesses to go beyond simple volumetric measurement to assess the full range of water impact from all sites.
Another goal is to find sustainable sources for the raw materials it uses in its drinks, such as sugarcane, oranges, and maize.
By making its water footprint better, the company can reduce costs, improve the environment, and benefit the communities in which it operates.
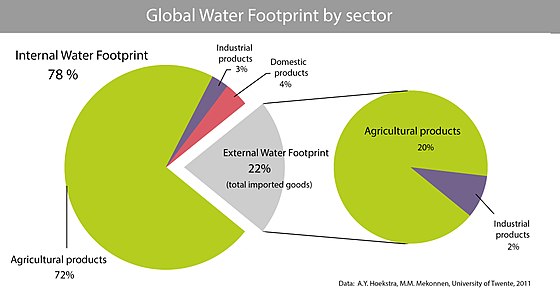
The water footprint of production and that of consumption, can also be estimated for any administrative unit such as a city, province, river basin or the entire world.
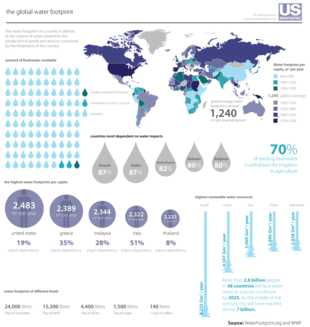
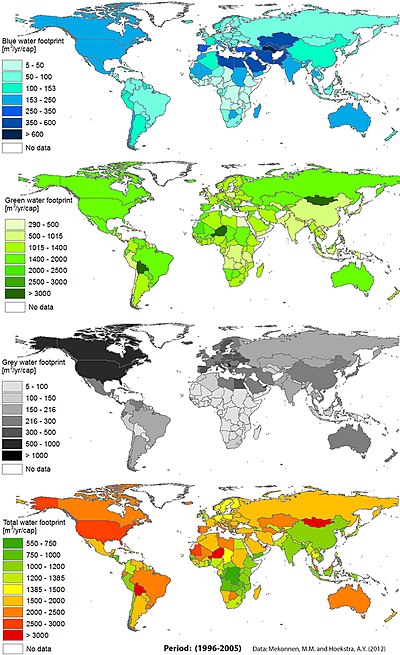
The global water footprint in the period 1996–2005 was 9.087 Gm3/yr (Billion Cubic Metres per year, or 9.087.000.000.000.000 liters/year), of which 74% was and green, 11% blue, 15% grey.
Some African nations, such as Sudan, Mali, Nigeria, Ethiopia, Malawi and Chad have hardly any external water footprint, simply because they have little import.
The agricultural products that on average contribute most to the external water footprints of nations are: bovine meat, soybean, wheat, cocoa, rice, cotton and maize.
[1] The top 10 gross virtual water exporting nations, which together account for more than half of the global virtual water export, are the United States (314 Gm3/year), China (143 Gm3/year), India (125 Gm3/year), Brazil (112 Gm3/year), Argentina (98 Gm3/year), Canada (91 Gm3/year), Australia (89 Gm3/year), Indonesia (72 Gm3/year), France (65 Gm3/year), and Germany (64 Gm3/year).
Energy production annual water consumption in the EU 27 in 2011 was, in billion m3: for gas 0.53, coal 1.54 and nuclear 2.44.
In ten years, from 2002 to 2012, the Gravity Recovery and Climate Experiment calculated that the groundwater reduced in 1.4 m yr−1, which "is nearly 8% more than the annual recharge rate.
"[47] The application and interpretation of water footprints may sometimes be used to promote industrial activities that lead to facile criticism of certain products.
For example, the 140 litres required for coffee production for one cup[2] might be of no harm to water resources if its cultivation occurs mainly in humid areas, but could be damaging in more arid regions.
The difference is due to the somewhat more complex nature of water; while involved in the global hydrological cycle, it is expressed in conditions both local and regional through various forms like river basins, watersheds, on down to groundwater (as part of larger aquifer systems).
[48][52] Several nations estimate sectoral distribution of use of water withdrawn from surface and groundwater sources.
[53] Sectoral distribution is different in many respects in the US, where agriculture accounts for about 39% of fresh water withdrawals, thermoelectric power generation 38%, industrial 4%, residential 1%, and mining (including oil and gas) 1%.