Wigmore chart
A Wigmore chart (commonly referred to as Wigmorean analysis) is a graphical method for the analysis of legal evidence in trials, developed by John Henry Wigmore.
[1][2] It is an early form of the modern belief network.
[3] After completing his Treatise in 1904, Wigmore "became convinced that something was missing."
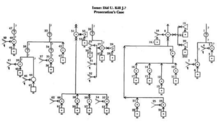
He set up a system for analyzing evidence that consisted of lines, used to represent reasoning, explanations, refutations, and conclusions; and shapes which represent facts, claims, explanations, and refutations.
[4] Recent scholars have rediscovered his work and used it as a basis for modern analytic standards.