Buffett indicator
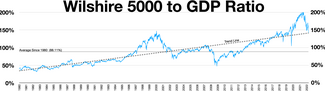
[1][2] It was proposed as a metric by investor Warren Buffett in 2001, who called it "probably the best single measure of where valuations stand at any given moment", and its modern form compares the capitalization of the US Wilshire 5000 index to US GDP.
[8] In the essay, Buffett presented a chart going back 80 years that showed the value of all "publicly traded securities" in the US as a percentage of "US GNP".
[8] Buffett finished the essay by outlining the levels he believed the metric showed favorable or poor times to invest: "For me, the message of that chart is this: If the percentage relationship falls to the 70% or 80% area, buying stocks is likely to work very well for you.
[11][12][13] In 2018, finance author Mark Hulbert writing in the Wall Street Journal, listed the Buffett indicator as one of his "Eight Best Predictors of the Long-Term Market".
[2] A study by two European academics published in May, 2022 found the Buffett Indicator "explains a large fraction of ten-year return variation for the majority of countries outside the United States".
[7] Reasons proposed include that GDP might not capture all the overseas profits of US multinationals (e.g. use of tax havens or tax structures by large US technology and life sciences multinationals), or that the profitability of US companies has structurally increased (e.g. due to increased concentration of technology companies), thus justifying a higher ratio; although that may also revert over time.
[20][7] Buffett's original chart used the Federal Reserve Economic Data (FRED) database from the Federal Reserve Bank of St. Louis for "corporate equities",[b] as it went back for over 80 years; however, many modern Buffett metrics simply use the main S&P 500 index,[3] or the broader Wilshire 5000 index instead.